|
The Weekly Report For March 7th - March 11th, 2011
Commentary: It was an interesting week to say the least. The markets had volatile swings in both directions and essentially finished where they started. After starting the week off on a positive note, the general markets pulled back steeply on Tuesday, dropping about 1.5% on average. However, two days later the markets rebounded sharply and were sitting back near the highs for the week. Friday started off very weak and it looked like the markets would end the week on a sour note, but a late rush in the afternoon pushed the indexes back to just about where they started. So while there was a lot of movement this past week, there was very little overall change in the daily charts.
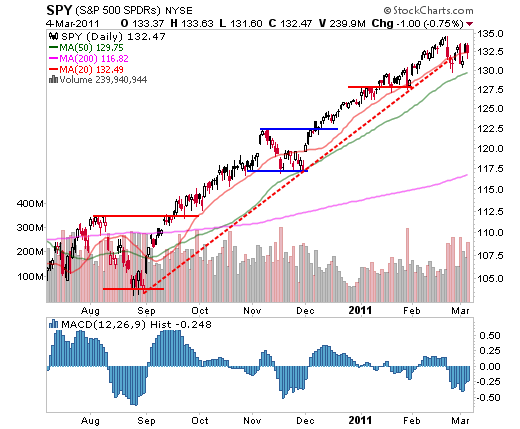
In fact, the markets are essentially trying to decide what happens next. In a consolidation, sellers form >support levels on dips. In looking at the Diamonds Trust, Series 1 (NYSE:>SPY), is also in a battle between buyers and sellers. While the past several sessions have certainly been volatile, notice that in actuality, volatility is starting to narrow. On the weekly charts, SPY printed an inside bar. This means that the entire trading range for the week was inside last week's trading range. This is another clue to suggest that the markets are trying to digest the recent price action. However, volume remains high overall, which hints at distribution versus consolidation. Traders should continue to monitor $130 in SPY as a near-term level; a break below this could signal a reversal.
|
|
| Source: StockCharts.com |
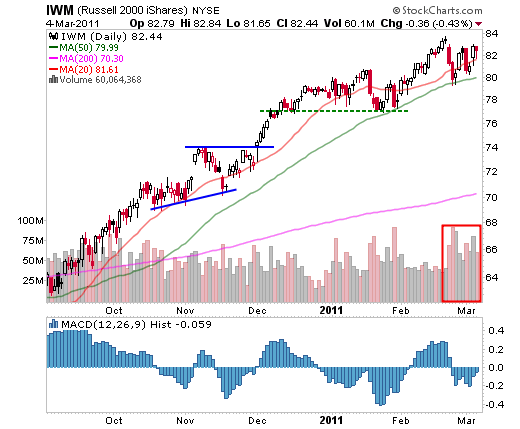
The Powershares QQQ ETF (Nasdaq:>moving average, it will look much better from a technical standpoint. However, if QQQQ reverses from this area, it could be the beginning of a >IWM) ETF chart remains much better looking than its peers if not for the high-volume churning that is occurring. Typically, consolidations should occur on dwindling volume as market participants reach equilibrium on an issue's price. This high-volume churning is typically emotionally charged as two sides battle it out and is more often distribution (unloading of shares from institutions to retail investors). Ultimately price action trumps volume action, so traders simply need to watch IWM to see if it can continue to build on its base and rally to new highs. This is a leading index, so its health is a good thing for bulls.
|
|
| Source: StockCharts.com |
The Bottom Line
We mentioned last week that the markets were leaving traders with a lot of questions. Unfortunately, despite some wide swings, the markets left traders wondering if the recent weakness will lead to a larger correction or whether buyers will step in once again. While many traders will take the strong close as a sign of confidence, there are still signs that the markets remain very vulnerable here. Notice that despite the wild swings, the indexes really only tested the large red candle formed on the “Libya News Gap Down”. Traders need to remain patient as the markets try to stabilize and find their footing. Many breakouts are stalling and leadership has been deteriorating. While the larger trend is still intact, it’s quite possible that the markets need more time to rest. This may come in the form of a pullback, or it may simply mean more weeks like this where the markets trade sideways.
|

