
Is Amazon.com the new Wal-Mart?
posted on
Jul 14, 2013 10:57PM
We may not make much money, but we sure have a lot of fun!

I wrote this article myself, and it expresses my own opinions. I am not receiving compensation for it (other than from Seeking Alpha). I have no business relationship with
The question in this article's title is quite relevant. Very often, the answer is said to be yes and it represents one of the strongest reasons to buy Amazon.com (AMZN) stock. Because who wouldn't want to have bought Wal-Mart (WMT) back when it was of a similar size to Amazon.com today?
Thankfully, we can provide an answer. We can do it because Wal-Mart has an excellent website which includes all its annual reports back to the 70s.
Our first problem is establishing when Wal-Mart was of a similar size to Amazon.com today. If we were to simply compare dollar revenues, we'd be introducing a significant distortion because of inflation. Wal-Mart was doing about as much revenues as Amazon.com is today back in 1994. But remember, selling $1 billion in merchandise in 1994 was not the same as selling $1 billion today.
We thus need to correct Wal-Mart's numbers by a consumer price index just to establish when it really was similar in size to Amazon.com. So starting from Amazon.com's 2012 revenues, $61.1 billion, we need to find the year in which Wal-Mart's revenues were closest to this figure, inflation adjusted.
The closest years end up being 1992 and 1991. In 1992 Wal-Mart did $43.9 billion in revenues. The CPI index was at 140.3 versus 229.594 at 2012 year-end, which means those revenues were similar to doing $71.8 billion in today's dollars. In 1991 Wal-Mart did $32.6 billion in revenues. The CPI Index was 136.2 versus 229.594 at 2012 year-end, which means those revenues were similar to doing $54.9 billion in today's dollars.
Knowing this, I'll use 1992 as the base year to compare Wal-Mart to Amazon.com today. I'll be drawing extensive data from Wal-Mart's 1992 annual report.
Size
Back in 1992, Wal-Mart had revenues of $71.8 billion in today's dollars. In 2012, Amazon.com ended the year at $61.1 billion. We can thus assume that at that point in history, Wal-Mart really was close to what Amazon.com is today.
Growth
The revenue growth leading to 1992 and 2012 was as follows for Wal-Mart and Amazon.com:

As we can see, the growth rates at this point were broadly comparable. At the end of the period Wal-Mart was even growing faster than Amazon.com is, today. Also, as of the last 2 quarters, Amazon.com's growth rate has even slowed down further to around 22% though Amazon.com is not yet of the size Wal-Mart had already attained during 1992.
Profitability
How were the two companies doing at similar points? Again we'll use 1992, 1991 and 1990 versus 2012, 2011 and 2010 to compare this. I'll use several measures for the comparison, including EPS as a percentage of the share price, ROE, EPS growth and return on revenues (net profit/revenues).

Additionally, let me reproduce an EPS chart to show how stable in their growth Wal-Mart's earnings were over the 10 years coming up to 1992. Compare that to the next chart, showing how Amazon.com's EPS did over the last 10 years.
(click to enlarge)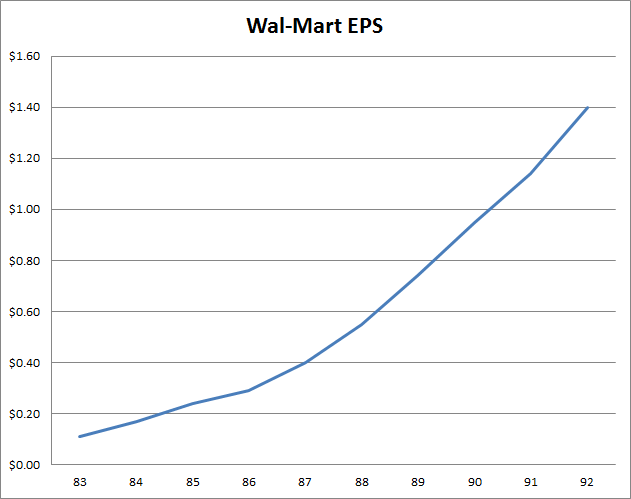

AMZN EPS Diluted TTM data by YCharts
There are several conclusions to be drawn from this profitability comparison:
Dividends
While Amazon.com doesn't dream of paying a dividend, Wal-Mart at this point in its history was paying dividends regularly. Its dividend yields were small given that the stock was quite expensive, but they existed nonetheless.
Wal-Mart paid $0.17, $0.14 and $0.11 per share during 1992, 1991 and 1990, respectively.
Investments
Quite often it is said that Amazon.com's massive earnings shortfall is due to it investing massively. To put this thesis to the test, we'll compare capex as a percentage of revenues both for Wal-Mart and Amazon.com at the same similar points in their history (Amazon.com's 2012 capex excludes the $1.16 billion HQ purchase).

As we can see, Amazon.com usually invested less than Wal-Mart, and only during 2012 were the levels of investment comparable. Yet Amazon.com uses this "we are investing" meme to justify its much lower profitability - when in fact even when it was investing much less, its profitability lagged Wal-Mart's severely.
One final, massive difference
There is a single other detail which clearly sets Wal-Mart and Amazon.com apart. That is the days payable outstanding. These were as follows:

Amazon.com is squeezing its suppliers hard, having a days payable of around 105 days at year-end. At the same time, Wal-Mart had this statistic around 37 days in the period we analyzed. Over time this will probably mean Amazon.com will get worse pricing terms from its suppliers, or it will have to do without such long payment terms, draining liquidity.
(Days sales outstanding was calculated as payables/cost of sales x 365)
Conclusion
Looking at Wal-Mart's size, growth, dividends, profitability and investments when it was the same size as Amazon.com today completely debunks the notion that Amazon.com is somehow behaving like the next Wal-Mart. Amazon.com is less profitable, has much higher earnings volatility, does not pay dividends, is not growing faster at this point and did not invest more than Wal-Mart at the same point in history.
Yet Amazon.com trades much more expensively than Wal-Mart ever did, in spite of being inferior to Wal-Mart on every count, even if we compare the year - 2010 - where Amazon.com had its peak profitability.
There is little else to conclude but the obvious. That Amazon.com is a bubble. Yet it's a bubble that keeps on inflating in spite of having issued lowered guidance for 9 quarters in a row and having seen its earnings drop all the way from a $2.53 EPS in 2010 to less than zero in 2012. All the while, expectations for 2012 were north of $5.00 per share in 2010 and Amazon.com posted losses yet the shares went higher.
Indeed, even for the present quarter, expectations were $1.01 two years ago. Today those same expectations stand at $0.06, a 94% drop, and I wouldn't be surprised if the market went and celebrated "a beat" under these unreal conditions.
A final note: What happened in Amazon.com shows how the market is a game of odds. The odds were low for a stock going higher while starting from a high valuation and guiding massively lower for 9 quarters in a row, leading to losses instead of large expected profits and also leading to a 94% drop in expectations for the present quarter. And yet, the underdog sometimes arrives first. The unlikely card sometimes comes up in the river and wins games against the odds. Low odds are different from impossibility. What happened in Amazon.com, for those shorting it, was a bad beat. But it's still a bubble. It will still blow up at some point.