
SURPRISING UPDATE: Canadian Silver Maple Sales Stronger Than Last Year
posted on
Aug 28, 2014 09:46AM

ONE COUNTRY, ONE METAL


In a surprising update, Canadian Silver Maple Leaf sales for the first half of 2014 surpassed sales during the same period last year. According to the Royal Canadian Mint’s Q2 2014 Report, just released, sales of Silver Maples hit a new record of 15.4 million ounces in the first half of the year.
If we look at the chart below, we can see that the Royal Canadian Mint sold an additional 1.4 million Silver Maples in the 1H 2014, at 15.4 million compared to 14 million during 1H 2013.

Thus, 1H 2014 sales of Silver Maples are 10% higher than 1H 2013. If we compare Silver Maple sale to Gold Maple sales, its a totally different picture indeed. Gold Maple sales are down considerably in the first half of 2014. The Royal Canadian Mint sold 681,000 oz of Gold Maples in the 1H 2013, compared to only 337,000 oz in 1H 2014.
This is a stunning 344,000 oz decline in Gold Maple sales or a 51% drop year-over-year. If we combine U.S. Gold Eagle and Gold Maple Leaf sales for 1H 2014, this is the result:
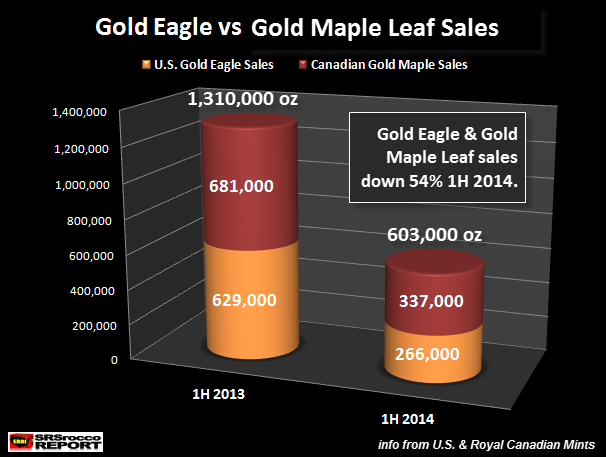
The U.S. Mint sold a pathetic 266,000 oz of Gold Eagles during the first half of 2014, compared to 629,000 oz during the same period last year. Together, total Gold Eagle & Maple Leaf sales were 603,000 oz in the first half of 2014, down a whopping 707,000 oz (-54%) in comparison to the 1,130,000 oz in the 1H 2013.
It is plain to see that for whatever reason, investors have cut back considerably on their retail gold bullion investments in 2014. However, this is not the case in the physical silver market. This next chart shows how much stronger physical silver buying is in the top two Official Coin Sales Markets.
In the first half of 2014, combined U.S. Silver Eagle and Canadian Maple Leaf sales hit a new record of 39.5 million ounces. Even though this is only up slightly higher at an additional 500,000 oz compared to 39 million in 1H 2013, it is still positive growth while Gold Eagle and Gold Maple sales are down a staggering 54%.
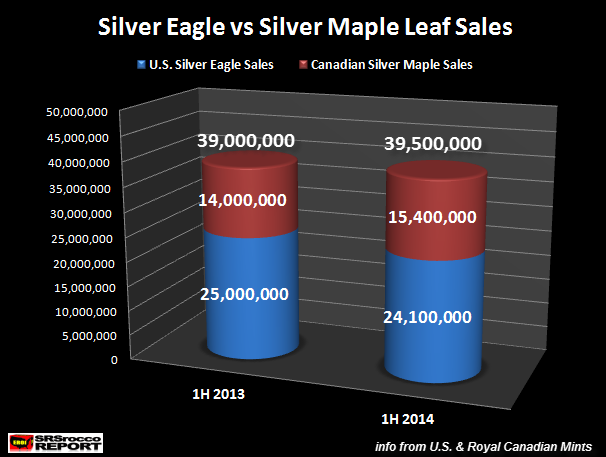
As we can see from the chart, the increase in Canadian Silver Maple sales (+1.4 million oz) offset the 900,000 oz decline in U.S. Silver Eagle sales. The reason for the increase in Canadian Silver Maples sales this year over last is due to a relatively strong first quarter.
Sales of Silver Maples were 8.2 million Q1 2014, compared to 6.6 million Q1 2013. Second quarter sales this year were slightly lower at 7.2 million, versus the 7.4 million oz Q2 2013. Silver Eagle sales Q2 2014 were down 600,000 oz compared to Q2 2013. Which means, Silver Maple sales fell less in percentage terms at 3% y.o.y. versus the 6% decline of Silver Eagle sales during the same period.
The Silver to Gold buying ratio in these to Official Coin Sales jumped up dramatically in the 1H 2014 due to the large drop-off of Gold Eagle & Maple purchases
Silver Eagle-Maple vs Gold Eagle Maple Sales
1H 2013 = 30 / 1
1H 2014 = 65 /1
The majority of investors are still wrapped up in the biggest Paper Ponzi Scheme in history. Even though retail gold bullion buying is down in the top two Official Coin Markets, sales of Silver Eagles and Maples remains stubbornly strong.
I will be coming out with a new article shortly titled, “U.S. Retirement Asset Bubble vs Physical Gold Investment.” It’s amazing just how big of a bubble the total U.S. Retirement Market has become.
Please check back for new articles and updates at the SRSrocco Report. You can also follow us at Twitter below:
![]()

