
A BS of A study of EEStor Stacking Effect by fdesloges
posted on
May 24, 2017 11:45AM


The professional scambagger from PLI is going to post a finalized version of the following on the EESCAM long investors website hoping to find new suckers/investors for EEScam. Fibbo is assisting him in editing the BS.
There are only a few parameters of a capacitor that really matters to a long EEStor investor. One of these is the self-discharging time constant.
The dielectric in between the plates of a capacitor is never a perfect insulator. It has a breakdown voltage beyond which, well.. it breaks down! :-) It also leaks over time, causing a tiny electric current to flow from one plate to the other (to keep it simple).
It's a natural phenomenon that follows [url=http://www.learningaboutelectronics.com/images/Capacitor-discharging-time-constants-graph.png] an inverse exponential curve[/url]. This is like a leaky water reservoir, where more water would leak initially than later due to higher pressure when the reservoir is full. It is also similar to what happens with the radioactivity level of any radioactive material as it decays over time.
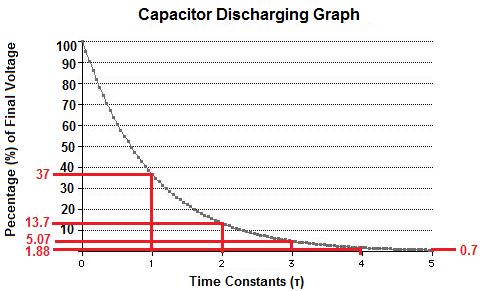
Most of us are familiar with the half-life of such radioactive material, right? It's the time that it takes for the radioactivity level to be cut by half and it is constant for a specific material. So, it will take the same amount of time for the radioactivity to be cut in half than to be cut a further quarter, etc. The equivalent for a capacitor is called the time constant of the capacitor. But instead of the half-life it measures the time when ~63.2% of the voltage has leaked (or more formally, the time it takes for the voltage to reach 1/e of it's original level, where e is the Euler number = 2.718281828459045, so 1/e = 0.36787944117144233).
[img]http://www.learningaboutelectronics.com/images/Capacitor-discharging-time-constants-graph.png[/img]
So as seen in the picture above, the time it takes for a capacitor to self-discharge 63.2% of its originally charged voltage is equal to one time constant. After 2 time constants, the capacitor has self-discharged 63.2% of the original voltage plus a further 63.2% of the remaining 36.8%, for a total of 86.5% (1/e² voltage level remaining). After 3 time constants this figure is 95% (1/e³ remaining). After 4 time constants it is 98.1% and after 5 time constants, 99.3% of the original voltage is lost.
Similarly, at one third of the time constant, there will be (e power -1/3) = ~72% of V remaining. And since the energy stored in a capacitor is proportional to V², there will thus be (e power -2/3) = ~51.3% or about half the energy left. The time where about 90% of the energy is conserved is the twentieth of the time constant (e power (-1/20 x 2) = 90.5%). You would similarly need one sixth of the time constant to keep 72% of the energy.
Number of Time Constant 1/20 1/6 1/3 1 2 3 4
Voltage remaining 95.1% 84.6% 71.6% 36.8% 13.5% 5.0% 1.8%
Energy remaining 90.5% 71.6% 51.3% 13.5% 1.8% 0.2% 0.03%
Conveniently enough, it appears that the time constant (TC) of a capacitor can be calculated by multiplying the internal resistance R of the capacitor, measured in Ohms (Ω), by its capacitance C measured in Farads (F). The result is measured in second. (Yeah, I know, [url=https://en.wikipedia.org/wiki/Farad]it's weird![/url])
So TC = R x C
Note that resistance is really the inverse of leakiness. If you double the resistance to electric current of anything you really make it leaks half the current.
Why is it that TC is so important ?
Well obviously, an eventual Electrical Energy Storage Unit (EESU) would not be a useful battery replacement in most applications if it held most of its charge for only 5 minutes. You want to be able to come back from traveling and not find your EESU powered electric car totally empty after two weeks.
In the same way, in the Grid market that EEStor plan to conquer, it appears the key driver to unlock further market shares where an EEStor capacitor would be price disruptive would precisely be that time constant. The longer a capacitor is able to hold its charge while it's not used, the better. The [url=http://www.sandia.gov/ess/publications/SAND2010-0815.pdf] Sandia report[/url] referred to in [url=http://www.eestorcorp.com/assets/nov-14-2016-enhanced-stacking-white-paper-final.pdf]the EEStor Enhanced Stacking White Paper[/url], provides a complete breakdown of market shares by discharge duration. For instance, EEStor is claiming in its [url=http://www.eestorcorp.com/q---a.html]Q&A page[/url] that the 16 layer stacks used in the MRA and Intertek Phase 4 tests last November 2016, with its time constant of about 193 second, would already make EEStor price disruptive in anything which requires a discharge duration less than a minute.
So what is that unusual Stacking Effect that EEStor is talking about?
The [url=http://www.eestorcorp.com/assets/nov-14-2016-enhanced-stacking-white-paper-final.pdf]Stacking White Paper[/url] provides a few notable cues to help us understand.
"In a normal stacking process, as layers are added, the resistance of each layer will be in parallel with the next layer. As resistors are placed in parallel the resistance is divided by the number of resistors in the parallel circuit. For example, if two 100 ohm resistors are placed in a parallel stack, the parallel resistance will be 50 ohms. "
That makes sense since when you connect two identical capacitors in parallel, it's the equivalent of having a single capacitor with double the plate surface. So you normally double the charge (and thus the capacitance) it can hold. But at the same time there's twice as much surface to leak charges through - and double the leaks means you divide the resistance by 2 (or multiply it by ½).
So normally each time you stack layers connected in parallel like that, you double the C and you multiply the R by ½, so the time constant of the stack should not change:
TC = ½xR x 2xC = R x C
But what happens when EEStor builds such a stack of its CMBT layers connected in parallel ?
The Phase 4 third-party tests results released on 2016-11-14 gives us a first data set to study.
The 4, 8 and 16 layers samples measured by MRA show C equals to 1.33, 3.03 and 7.67 ηF respectively.
And the same samples measured by Intertek show C equals to 1.28, 2.95 and 6.99 ηF.
If we take the average of Intertek and MRA, it gives us C equals to 1.305, 2.99 and 7.33 ηF.
Now these values are slightly biased because the average layer thickness of the 4, 8 and 16 layers samples are not equal, at 72.1, 75.4 and 69.1 µm respectively, and C goes down linearly as thickness of a layer. So if we correct all the average C values above for a layer thickness of 72.1 µm, it gives us corrected average C values, for the 4, 8 and 16 layer samples equal to 1.305, 3.127 and 7.025 ηF.
Whereas the expected doubling effect should give C equals to 1.305, 2.61 and 5.22 ηF.
So, C is 20% higher than the double expected from the doubling of 4 layers to 8 layers.
And further 12% higher than the double expected from the doubling of 8 layers to 16 layers.
The self-discharge TC is also measured by MRA going from 70 to 138 to 191 second, and by Intertek going from 75 to 145 to 195 second, for an average of 72.5, 141.5, and 193 second, instead of staying constant at 72.5 second.
So it is 95% higher at 8 layers and a further 36% higher at 16 layers than without this Stacking Effect.
The R is also calculated with TC / C going from 55.6 to 45.3 to 27.6 GΩ, instead of 55.6 to 27.8 to 13.9 GΩ.
So it is 63% higher than the half expected from the doubling of 4 layers to 8 layers.
And further 22% higher than the half expected from the doubling of 8 layers to 16 layers.
These results are absolutely unusual, as they breaks the Classical Laws of Capacitor Physics, which say that TC should remain constant with stacking, pure and simple.
The [url=http://www.eestorcorp.com/assets/nov-14-2016-enhanced-stacking-white-paper-final.pdf]White Paper[/url] then goes on further to say:
"EEStor calculates that using the stacking methodology to keep resistance high, a stack of 320 layers would have a capacitance 140 ηF and a time constant of 64 minutes giving the device a discharge duration of over 5 hours."
Now let's pause for a second because this is a HUGE claim.
It allows us to uncover a fundamental property of the EEStor Stacking Effect:
Providing that a 320 layer stack would have a 140 ηF capacitance and a 3840 second time constant (64 minutes), now considering that is 40 x the numbers of layers in the 8 layers sample where the measurements by MRA and Intertek averaged 3.127 ηF and 141.5 second.
So they expect a 44.77x C improvement and a 27.14x TC improvement over that 8 layers sample.
40x more layers is doubling 5.32 times (2 power 5.32 = 40).
That's a little under 1.86 at the power 5.32 that gives a 27.14x TC improvement.
So the linear TC multiple with layer doubling would be a little above 1.85!!!
Note that this 320 layer claim is most probably based on the many, many stacks built in-house at Cedar Park.
The ~1.85 factor suggested in this claim is much closer to the 1.95 average factor from 4 to 8 layers then the 1.36x average factor from 8 to 16 layers measured at MRA and Intertek last November. So there's a strong suggestion that the 16 layers sample sent to IT-4 and MRA would have a time-constant and resistance that is, for some reason, off norm.
Anyone that has had a high tech career can attests that such missteps happening in official tests due to a bad behaving sample can always be way possible.
It could also be said that Ian Clifford would never claim something that big in the White Paper without serious internal measurements to base his claim on. That would seriously clash with the level of cautiousness he has shown his shareholders since he took back the lead at EEStor Corp.
If this ends up being confirmed to be true in further third party tests, you have no idea how stunning this linear 1.86 factor is!
Even compared to a relatively large, say, 1.7 factor. This additional little 0.16 in the exponential function matters!
1.7 with 10 doublings to 1024 layers (so power 10) = 202x
1.86 with 10 doublings to 1024 layers (so power 10) = 496x
If we use the 8 layer stack sample used in Intertek-4 / MRA tests as a reference, a 1024 layers stack would be 128x or 7 further layers doubling larger. Thus the time constant would get 1.86 power 7, that's 77, times larger!
So the 8 layers stack 141.5 second TC would increase 77x = 10896 second.
That's 3 hours! With the good old epoxy polymer used as binder. Just due to Stacking Effect. So that's the Mona Lisa of capacitors that had been put on the auction block for tier-one mammoths to bid on in early February 2017.
Note that we stopped at 1024 layers for practical considerations. At 72 µm per layer that gives you a ~10 cm (4 inch) thick capacitor, when one adds the metal plates. For stability issue it would of course have to be made of layers of a diameter much larger than the 0.75 inch diameter layers currently produced for sampling purposes in Cedar Park. (The [url=http://www.eestorcorp.com/q---a.html]EEStor Q&A page[/url] mentions layers of 15 inches of diameter.)
====
A last thing to consider about the unusual EEStor Stacking Effect shown by the Phase 4 third party test results, is that even the C doesn't behave as expected by the Classical Laws of Capacitor Physics. It's supposed to double along with the parallel layers doubling, but in the samples measured above, with every doubling of layers, the C really grows 12-20% further than just doubling. It appears EEStor is able to tune how the stack is built to either maximize TC, or like in the samples studied above, sacrifice some TC to provide a further C, and thus ED boost for the cases where TC would already be overkill.
That was later confirmed in the 2017-03-27 Phase 1 Energy Density News Release:
"This is of significant importance to the energy storage market, as the stacking effect allows stacks to be designed for either maximum watt hours per liter or to extend time constants, depending on the application."
So if, like above, the process can be tuned to get an average 20% C boost at every doubling, a 1024 layers stack would result in a 1.20 power 10 = 6.2x C increase above a normal stack of the same size. So considering the energy grows proportional to C, it means such a stack also gives you 6.2x higher energy density (ED) "for free". This is independent of any C (and thus ED) improvement given by a higher permittivity binder resulting from the EEStor advanced polymer program.
So it's eagerly sought after how far such a "C boost" factor can be pushed by EEStor. We know even a slight improvement in such a boost, with power of 10 for a 1024 layers stack, gives spectacular results. For instance, a small 6% increment in "C boost", from 20% to 26%, results in a final 1.26 power 10 = 10 x ED boost for a 1024 layers stack. That's a 60% improvement over the previous 6.2x ED boost calculated above, for only a 6% "per layer-doubling" increment.
====
Then, on 2017-03-13, EEStor released the Phase 5 third party test results.
On top of over 5x improvement in R, there was a nice data set of 4, 8 and 16 layers sample Stacking Effect to analyze. Here's the core of it:
The 4, 8 and 16 layers samples measured by MRA show C equals to 1.0, 2.63 and 5.5 ηF respectively.
And the same samples measured by Intertek show C equals to 1.14, 2.42 and 5.45 ηF.
If we take the average of Intertek and MRA, it gives us C equals to 1.07, 2.525 and 5.475 ηF.
The average layer thickness of the 4, 8 and 16 layers samples were not equal, at 81, 76 and 70 µm respectively. As C goes down linearly as thickness of a layer, if we correct all the average C values above for a layer thickness of 75 µm, it gives us corrected average C values, for the 4, 8 and 16 layer samples, equal to 1.156, 2.559 and 5.11 ηF.
Whereas the expected doubling effect should give C equals to 1.156, 2.312 and 4.624 ηF.
So, C is 10% higher than the double expected from the doubling of 4 layers to 8 layers.
But almost exactly the double expected from the doubling of 8 layers to 16 layers.
The self-discharge TC is also measured by MRA going from 800 to 2104 to 4400 second, and by Intertek going from 798 to 1694 to 3815 second, for an average of 779, 1899, and 4107.5 second, more than doubling with each layer doubling, instead of staying constant at 798 second.
So it is 138% higher at 8 layers and a further 116% higher at 16 layers than without this Stacking Effect. For an average of 127% higher than supposed at each layer doubling.
The R is also calculated with TC / C going from 691 to 742 to 804 GΩ, instead of 691 to 345 to 173 GΩ.
So it is 115% higher than the half expected from the doubling of 4 layers to 8 layers.
And further 117% higher than the half expected from the doubling of 8 layers to 16 layers.
For a compounded 116% higher than supposed at each layer doubling.
That's an absolutely mind blowing result. It means if that Stacking Effect is scaled by EEStor as it claims, a 1024 layer stack à la Phase 5 will boast a TC 309 time larger than an 8 layer's stack 1899 second. That's 587,246 second, or 6 days and 19 hours. All based on the relatively low permittivity epoxy-CMBT dielectric.
On the capacitance side however, a 1024 layer stack total compounded C gain would "only" be 43% higher than above normal relative to the 8 layer stack.
Thus the Phase 5 210% C factor with every doubling is about 21% lower than the ~232% C factor with every doubling of Phase 4 tests.
Whereas the Phase 5 227% TC factor with every doubling is about 63% higher than the ~164% TC factor with every doubling of Phase 4 tests.
Thus we can see that the Phase 5 samples have indeed been tuned to maximize TC rather than C, whereas in Phase 4 samples, some TC as been sacrificed to boost the C growing factor.
Note how the Phase 5 "TC boost" factors appear steady from doubling to doubling (115% and 117%). That contrasts with the Phase 4 TC results (195% and 136%), adding to the evidence that the 16 layer sample sent to Phase 4 test was probably flawed. But the steadiness of the Phase 5 results supports EEStor claim that its Stacking Effect regarding TC scales to much higher layer counts.
Also note how the "C boost" factors from both the Phase 4 (20% and 12%) and even more obviously, the Phase 5 (10% and 0%), are declining from doubling to doubling of layers. Again, the 16 layers sample from Phase 4 being probably flawed, it makes it difficult to extrapolate from so few data points. So it remains to be confirmed if the C boost is only a transitory phenomena, vanishing as layers count is doubled a few times more, or if it scales with more doubling as EEStor claims.
====
Now there is another very important consideration to keep in mind.
Remember the above formula to calculate the time constant: TC = R x C?
It states that the time constant grows directly proportional to any C improvement EEStor makes.
Conveniently enough, C improvement is the exact objective of the advanced polymer program now in full swing at EEStor, with higher polarity (and thus relative permittivity and thus C) candidate polymers both from in-house and exterior teams, being sampled and tested.
Just for reference, both 2016-11-14 Phase 4 samples and 2017-03-13 Phase 5 samples boast an Energy Density (ED) of about 0.02 Wh/l and a relative permittivity k of about 8.
Now on 2017-03-27, EEStor reported of Phase 1 third party ED test results giving a relative permittivity k of 16,000, but tested at a rather low 0.11 V/µm. The minute EEStor publishes results with voltage back in the 70 V/µm area that they've got us used to, the ED would jump at above 100 Wh/l. But the material relative permittivity k growing from about 10 to 16,000 would also result in C growing accordingly by about 2000x.
The immediate consequence would be to also have the TC = R x C improved by 2000 too.
So improving over a 1024 layer stack with a Phase 4 TC of 3 hours, providing it starts with a single layer R in the phase 4 range of 100 GΩ, would give a TC of 6000 hours, or 250 days - over 8 months! And improving over a 1024 layer stack with a Phase 5 TC of 163 hours, providing it starts with a single layer R in the Phase 5 range of 500 GΩ, would give a TC of 326,000 hours, or 13,583 days - 37 years! At such high levels of TC, it would most certainly make sense to stack layers à la Phase 4, sacrificing some TC for a significant further increase in C and ED.
One could only wonder the crazy levels of TC that EEStor could reach with enough polarity and relative permittivity to match the original EESU spec at 700 Wh/l (a 7x further increase)!. That would give a TC anywhere between 4¾ and 260 years! Which means the EESU would still have kept 90% of it's energy after anywhere between 3 months and 13 years. That should make for an acceptable enough rate of leaking. :-)
A last point. We've seen earlier that it remains to be seen if the above normal C growth in Stacking Effect à la Phase 4 scales with more doubling as EEStor claims. That would of course have stunning consequences. As any further 6.2 boost in ED is always welcome. But the long EEStor investor should appreciate how much the unusual TC part of the Stacking Effect alone could still have a huge impact on the final ED of the EESU.
It's been indeed shown time and time again through the story of EEStor, that the quest for the breakthrough dielectric is mostly about an exercise in balance, tuning the dielectric material to get high value for three main parameters: the relative permittivity k, the dielectric strength (V/µm) and the self-discharge time constant / internal resistance R (Ω). Many times in the past, two parameters were maximized at the expense of a third, leading to a dead end. But with the Stacking Effect, EEStor can now optimize mainly for permittivity and dielectric strength alone, as starting with a lower resistance for a single layer would not have devastating effect on a final stack time constant. The Stacking Effect larger than 3000 improvement of TC over 1000 layers would take care of fixing the weakness. That factor is enough to boost a TC from 60 minutes to 5 months, and from 24 hours to 10 years.
Considering the current EEStor quest to disrupt the energy storage markets, this cannot be disregarded."
![http://www.learningaboutelectronics.com/images/Capacitor-discharging-time-constants-graph.png[/img]](http://www.learningaboutelectronics.com/images/Capacitor-discharging-time-constants-graph.png%5B/img%5D)