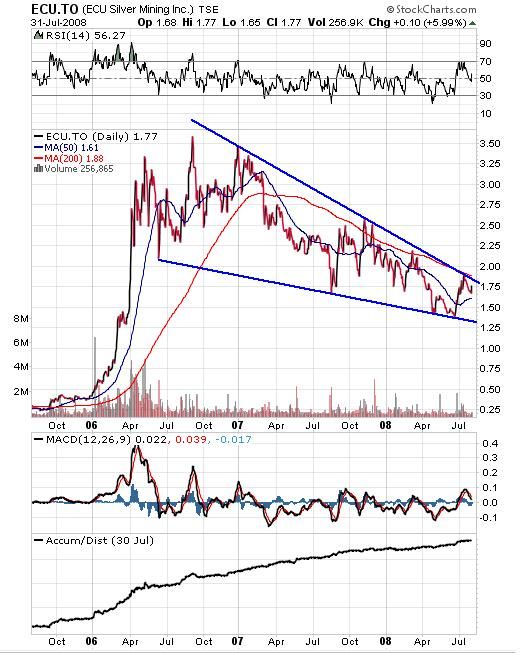
The current market for JPMs is eerily similar to how they performed in 2005 when we witnessed an intra day low for ECU in late May '05 from the high in April 2004. The 17-month downtrend did not resolve itself until four months later (September 2005) when the share price finally smashed through the 200 dma and the corresponding long term downtrend, on its way to establishing significantly higher share price levels.
Today ECU broke out of a 3-week retracement after putting in an impressive move from $1.32 to $1.94 in only a few short weeks. As illustrated in the following charts, ECU has now established a higher platform for yet another attempt at piercing that stubborn 2-year down trend and massive falling wedge formation. You also have to love the appearance of the accumulation/distribution index on the 3-year chart.
These patterns tend to repeat so we should carefully watch how it reacts when it makes its next approach at the $1.90 level.

