Re: Elliot Wave Gold
in response to
by
posted on
Jan 24, 2009 07:32AM

Golden Minerals is a junior silver producer with a strong growth profile, listed on both the NYSE Amex and TSX.

Alf did in fact make $735 his peak for the end of MAJOR WAVE ONE even though it did not meet his requirements at the time. The unusually large retacement back to $563 gave the impression of a WAVE TWO down when in fact it was part of a larger triangle formation. Below he describes his reasoning during his final update in November. Hopefully he changes his mind and continues to provide his EW analysis.
The current situation:
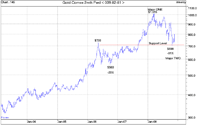
The chart below depicts the Comex Gold price on a weekly basis. In February 2006, in Update IV, the $630 target was increased to $768 as a result of intervening market action. A couple of months later the gold price exceeded $630 and moved to $733 in May 2006. From that point a 23% correction to $563 occurred.
Confusion reigned because a relatively minor correction had been anticipated, to be followed by a rise to $768. Thereafter the long awaited 25% to 33% correction was scheduled to occur. Instead, the decline measured 23% and the obvious conclusion was that this was the long awaited 25% to 33% correction, albeit slightly stunted. Quite possibly I was overly influenced by my previously unpublished rough target of $750 followed by a decline to $500. The actual outcome of a peak of $733 and a correction to $563 was remarkably close to my rough estimate and seemed to adequately fit the requirement for the end of Major ONE and the corrective wave Major TWO. In coming to this conclusion I glossed over the fact that the correction to $563 was an obvious triangle, and triangles are almost always 4th waves, yet I was calling it a 2nd wave, Major TWO. I also glossed over the fact that the correction was below the 25% to 33% magnitude required.
I mentioned previously that the early corrections were 4%, 8% and 16% at increasing orders of magnitude. If one were to be pedantic, one would say that the next level of correction should be 32%. Looking at the chart below, the correction from $1015 to $699 is 31%! It sticks out like a sore thumb. Surely this is exactly the 32% correction that we should have been anticipating for Major TWO?

Assuming that the $699 low on 23 October 2008 turns out to be the actual low point of the correction, and that remains to be proven, then we can conclude that we have seen the low point for Major TWO. That will allow us to update my original "back of the envelope" template to much higher levels, as follows:
Major ONE up from $256 to $1,015 (actually 4 times the $255 low);
Major TWO down from $1015 to $699, say $700 (a decline of 31%);
Major THREE up from $700 to $3,500 (a Fibonacci 5 times the $700 low);
Major FOUR down from $3,500 to $2,500 (a 29% decline);
Major FIVE up from $2,500 to $10,000 (also a 4 fold increase, same as ONE)