
Noteworthy Charts
posted on
Aug 08, 2009 10:49AM

Golden Minerals is a junior silver producer with a strong growth profile, listed on both the NYSE Amex and TSX.

Yesterday, Nathan put together a decent series of charts and running commentary that dispel the fabricated "green shoots" theory.
Cheers - VHF
-
Employment Situation In Chart Form
Nathan Martin
August 7, 2009
Since a picture is worth one hundred million words from the BLS, I decided to let the Fed’s own charts once again do the talking.
After reviewing the employment charts at the St. Louis Fed (Fred), that were updated just today, I have come to the conclusion that ultimately we are all going to wind up being government employees who do nothing but cut each other’s hair! Oh, and those who don’t do that will work in the “financial” industry.
And just so you can see clearly how GOOD TODAY’S NEWS really is, here is a generic chart of what the sheeple are shown from the BLS, U3 unemployment. I very subtlely pointed out the green shoot in today’s employment situation update – it’s there on the chart, you can see it clearly:
Clearly the equity market's reaction today was commensurate. Oh, and the numbers were completely legit, just ignore this little chart made by Chris Martenson showing the highest “birth/death model” adjustments ever in the month of July:
Of course, as ugly as that unemployment chart is, I hope everyone who visits my site realizes that the current U3 number is NOT comparable to the way Unemployment used to be tracked. Oh no. For that, we turn to John Williams at Shadowstat.com where he presents U6 as well as his “SGS Alternative:”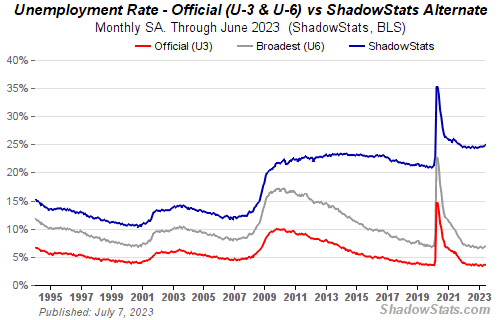
*Note: the little turn down in U6 (over 16%) is only there because of seasonal adjustments.
But you know what? Even John William’s 20%+ unemployment calculation didn’t really grab my attention. Oh no. What really caught my eye this time was this chart:
Look at that chart. The United States TODAY employs FEWER people to manufacture Non Durable Goods than we did during WWII! And that’s with a population that has grown from 130 million to over 306 million!
Or if you really want to compare the employment numbers with a figure, why not use the “Civilian Noninstitutional Population?” What’s that?
In the United States, the civilian noninstitutional population refers to people 16 years of age and older residing in the 50 States and the District of Columbia who are not inmates of institutions (penal, mental facilities, homes for the aged), and who are not on active duty in the Armed Forces.

Of course Non Durable Goods Manufacturing would be things that aren’t built to last! Where on earth do you suppose you would go to build those? China of course!
Sure, we are now a “service economy.” We don’t build things, we let others do that while we all cut each other’s hair, do manicures, “engineer” financial products (rob people), and blog for a living. It’s a terrific economy really, much better than Zimbabwe. After all, China’s still sending us their nondurable goods!
Least you think that jobs have only been lost in the nondurable goods jobs category, please take a look at the Durable Goods Manufacturing employment. Much better there, we have only given up every single bit of employment growth there since about 1947:
Stunning.
Yes, when it comes to manufacturing in the United States, welcome back to 1940 my employment seeking friend:
But you know how bad the financial industry has taken it on the chin. Let’s take a look at employment in that field, they must be hurting as bad…
Oh. Maybe not as much. I’m sure the geniuses at Goldman deserve that $700,000 average bonus for figuring out how to keep themselves employed while laying off the rest of working America which is exactly what has happened over the past 30 years.
And since we don’t manufacture much of anything, we don’t need as many employees to mine stuff, either. Again, whatever we need we can get from overseas.
Good thing we can all flip burgers at McDonald’s because the service industry employment is hanging tough:
Would you like fries with that?
But if you work in information services, you know, the high tech field of computers and the internet, it’s a good thing you work in a stable and growing career field:
Oops. Sorry. Don’t worry, just write if you’d like me to talk you through that short sale – it’ll only affect your credit for a year or three.
It’s a good thing that governments, like the State of California, are so fiscally healthy, I mean just look at all the employment growth there!
No slow down there! YET. But you can quote me on this, IT’S COMING.
Of course we know that construction is also hurting... just not as much as I would expect. I think this is one area of employment that is still overdone. Only back to the year 1998? Not good enough! We still have way too many houses, way too many strip malls, and way too many office buildings:
And, as to the myth that Americans work a 40 hour work week… NOT ANY MORE. Now 33 hours per week is average – yet another form of underemployment:
Look real hard, there’s a green shoot at the end of that chart too.
No wonder stocks are priced at a P/E of 120+!
As far as the percent of the population that’s working? Never seen a better example of a head and shoulder’s pattern! I think Point showed us that one earlier, but here we are back to about 1978:
The problem with this is that back in the 50’s, 60’s, and 70’s most families only had one working person supporting the entire family. Today it takes at least 10 just to support the necessary 8 computers, 4.5 cars, 18 cell phones, and $4 a gallon gasoline. Not to mention all the other cheap nondurable goods made in China. Yet, my point is that with that type of employment ratio we are back to the same raw numbers of workers as in the way back past. That means that for every household today that has two fully employed workers, there is at least one houshold with NONE.
When it comes to the length of time spent on the unemployment payrolls, here we can finally see what the rally today was all about. Just look at the chart showing civilians who were unemployed for 5 to 14 weeks. A big drop, no doubt:
But you’re going to have no luck seeing ANY decline in the number of people unemployed for longer than 15 weeks:
Nearly 8 million people! Now look at this chart showing the number of civilians unemployed for 27 weeks or longer! Yes, that's 5 million people drawing benefits for that long or longer...
And here's the mean length of time of all those on unemployment:
Anyone else see a rising trend there? Maybe it's just me, obviously all the other market participants are seeing something vastly different.
Don’t worry about those who are in danger of running out of benefits after exhausting their 79 weeks worth though. I understand that little Timmy Geithner is looking into extending those benefits even further... Of course the benefit to Timmy and the Bankers is that by giving 34 million Americans free food, and millions more pay for not working, is that they can still sit on the couch and watch the NFL which is coming back on television real soon!
I believe that is method number 3,366 in the central banker playbook, “How to Placate an Entire Population so that they don’t Hang You from the Nearest Tree.” I hear it’s a best seller, and fortunately there are still plenty of employed financial engineers to keep the book sales up!
And this is why someday soon we will all be government employees who do nothing but cut each other’s hair, “engineer” financial products, and blog. Damn, I knew I should have moved to New York and found a job on Wall Street.