| |
|
Gold and Silver Parabolics - Part II
|
|
|
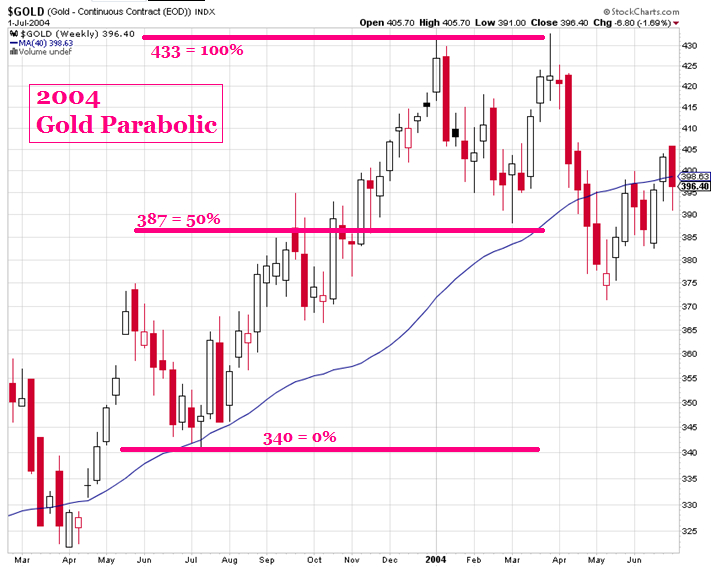
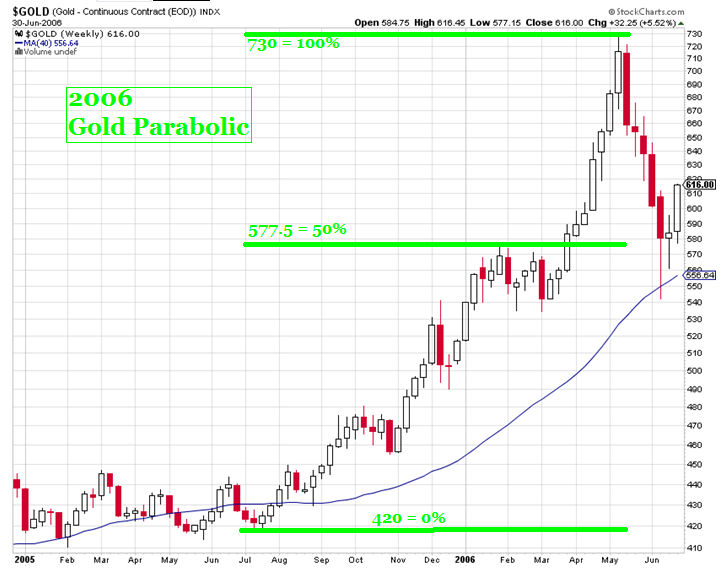
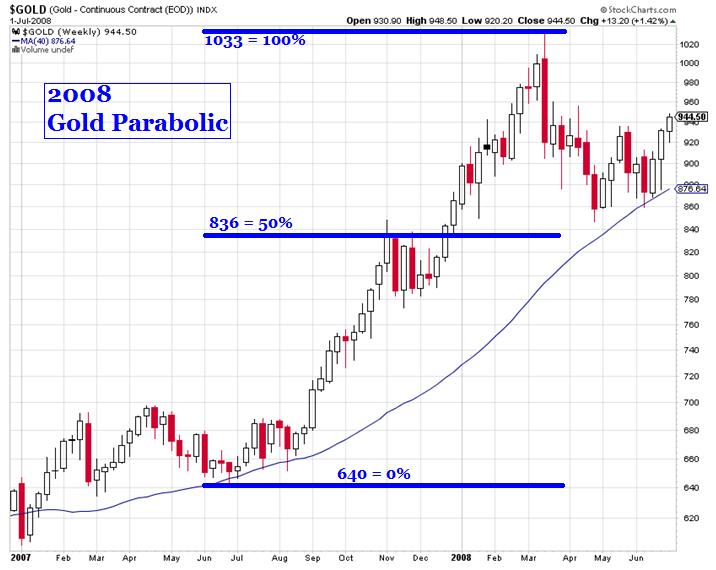
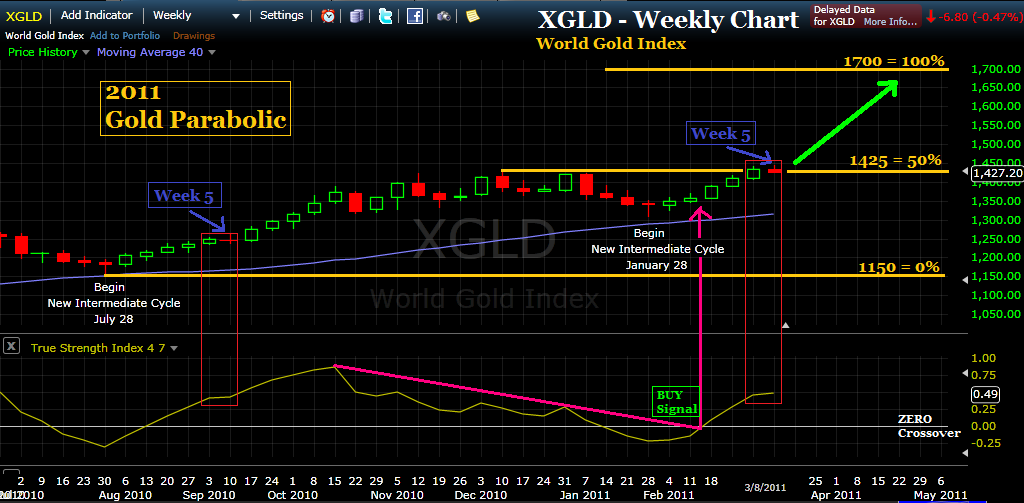
As you will discover from the charts and information in this article, the previous three gold and silver parabolics (2004, 2006 and 2008) had a common characteristic. Each exhibited a midpoint consolidation - a resting place that separated the character of the first half and second half of the parabolic move. This observation is particularly relevant at this time, as both gold and silver have presently completed this midpoint consolidation and are already on their way to concluding the 2011 parabolic.
Let's begin with the previous parabolics in gold and silver and work our way towards the current situation. At the conclusion I will show you what I think is likely to power the 2011 parabolics to completion.
 width="640" /> width="640" />
The silver 2004 parabolic consolidated at and below the $6.62 price level. As with the 2004 gold parabolic, once price cleared the consolidation area it continued higher powerfully and without hesitation.
 width="640" /> width="640" />
The 2006 silver parabolic spent quite a number of weeks back and filling before reaching its half way point just below $11.00. But once the first leg was concluded price movement was nearly vertical and extremely swift.
 width="640" /> width="640" />
The 2008 silver parabolic exhibited a bull flag at about the 1/3 mark, then spent a few weeks consolidating half way up the entire move, around $16.30. As we have observed to be typical, the upper half of the parabolic move, once it left the midpoint consolidation area, was swift, decisive and powerful.
This now brings us to our current 2011 gold and silver parabolic. I am switching software at this point from charts by www.StockCharts.com to http://www.FreeStockCharts.com, the reason being that the latter allows me to adjust the price height of anticipated future price movement.
 width="640" /> width="640" />
Silver is a step ahead of gold in that it has already broken above its midpoint consolidation price area of $32, and is presently trading near $36. The weekly TSI indicator as yielded a bullish trend line break buy signal and I expect silver to continue higher week after week, as it has in the 2nd half of each previous parabolic move. Using the midpoint consolidation concept, price is projected some 40% higher to around $48.
 https://lh3.googleusercontent.com/-YxaZp27ZIf4/TXgsWpcEnNI/AAAAAAAABbo/bbXhXqRE7Dg/s640/uup.png" width="640" /> https://lh3.googleusercontent.com/-YxaZp27ZIf4/TXgsWpcEnNI/AAAAAAAABbo/bbXhXqRE7Dg/s640/uup.png" width="640" />
Finally, here is a weekly chart of PowerShares DB US Dollar Index Bullish Fund (UUP) which I am using as a proxy for the chart of the US Dollar.
We can see that the US Dollar is literally on the precipice of a waterfall decline below key support at 22. This roughly translates into 76 on the US Dollar Index.
The TSI momentum indicator is below ZERO and falling. This is bad news for the US Dollar and I view it highly unlikely it will be able to rebound, let alone hold this level. Once the US Dollar begins to fall below support it will trigger both panic and a flight to gold and silver. And I believe this will power the concluding leg of the 2011 gold and silver parabolics.
John Townsend
tsiTrader@gmail.com
|


 https://lh3.googleusercontent.com/-YxaZp27ZIf4/TXgsWpcEnNI/AAAAAAAABbo/bbXhXqRE7Dg/s640/uup.png"