
KISS
posted on
Jan 26, 2010 12:59AM

Creating value through Exploration and Development in the Sierra Madre of Mexico

This should be required reading for anyone on this forum who is growing impatient with what we all know is a fundamentally sound investment.
From Howard Katz - http://www.shtfplan.com/howard-katz/kiss_01252010
KISS is an acronym for the popular expression, keep it simple, stupid. I don’t particularly like the idea of calling others stupid. I have found that people who do so usually have an inability to express themselves, and this is because they themselves are stupid. Most people I have met in this world can do at least something better than I can, and I can benefit from their expertise. (This is what the economist calls division of labor and specialization.) At any rate, the simple part is very good. Most great ideas are simple (the 10 Commandments, Newton’s laws of motion).
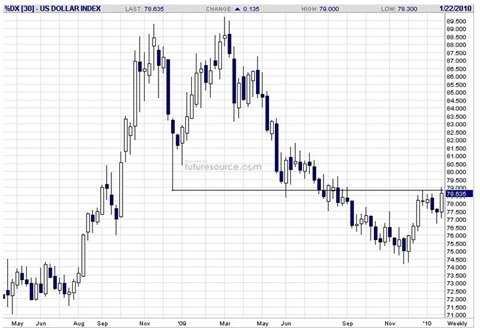
This week the One-handed Economist features a giant double top in the U.S. dollar index, a chart pattern which completed on Aug. 1, 2009 and has been dominating both the currency markets and the commodity markets ever since.
The first chart patterns were developed in the early 20 th century by the first technical analysts. These people were not happy with the fundamental approach because it did not seem to be working very well. They followed Charles Dow of the Wall Street Journal, who said that we don’t want to tell the market what it ought to do. Let us sit back and observe what it actually is doing.
This, of course, is the first principle of science. When one is confronted with a new problem, then step back and observe the facts.
Then these first technicians began to notice patterns in the charts they had been constructing. When certain patterns would appear, they would be followed by a bull move. Certain other patterns would be followed by a bear move. They began to use these patterns to predict the future behavior of the markets, and their predictions worked. At least the predictions worked most of the time, and that was good enough to make nice money.
The double top is a chart pattern in the shape of the letter M. It completes when the pattern breaks down below the bottom of the M. It then predicts that the market will make a further decline equal, in percentage terms, to the decline from the top of the pattern to the bottom of the M. In the chart above, this is a decline from 90 to 79, or 12%. Another further decline of 12% would amount to 9½ points, or 69½.
The early 20 th century technicians never took the step of applying the second principle of science, organizing the facts observed in accordance with the principle of cause and effect. What is a reasonable cause and effect analysis which makes sense of these chart patterns and explains why they work?
I discovered the answer to this by studying the philosopher Ayn Rand. Miss Rand pointed out that abstract ideas are the key to understanding the thinking of other human beings. This is because abstractions are so broad and apply to so many different possibilities that they cover pretty much everything that can happen. At the same time, abstractions are simple and can be understood by pretty much any normal human. If we look at economic abstractions (or economic philosophy), we find two ideas. In the 12 th century, Thomas Aquinas argued that every good has a fair price and should trade at its fair price. In the 18 th century, Adam Smith argued that there is no such thing as a fair price, that the only “fair” price is the price agreed upon by buyer and seller.
Well, Thomas Aquinas was wrong, but through the Catholic Church he has had a powerful impact on the thinking of mankind. So even here in the 21 st century most people go around believing in the principle of the fair price.
And since we are speculators in the markets, it is necessary for us to introduce one more principle, the principle of Yogi Bear. Yogi Bear was “smarter than the other bears.” To make money in the markets, we must be smarter than the other speculators. To do that, we must know what they are thinking.
What are the other speculators thinking? They are thinking that the market has to trade at its “fair” price. But since they don’t really know what the fair price is, they simply take the price to which they are accustom, and this price may be deduced by the careful chartist. In the above chart of the dollar, we can see that 79 is a level about which the dollar seems to orient itself. We have now returned to 79 for the fifth time since Dec. 2008. Clearly 79 is perceived as a fair price by many dollar traders. At the present time, this point acts as a supply level, and it can be easily seen that the major trend is down.
The early chartists discovered the concept of a pull-back to support or resistance. When an economic good has completed a chart pattern, it will make one last move back to the pattern, back to the price in the pattern which they regard as fair. It is obviously the supporters of Thomas Aquinas who are doing the buying. In late November, we can imagine them thinking, “The dollar [then at 74] is too low. A fair price would be at least 79.” And so it came to be. But now the sense that the dollar is too low is gone. The followers of Adam Smith are shorting the blazes out of it. The support at 79, which was effective in May ’09, is gone. It was broken on August 1, 2009.
The experienced chartist takes a quick look at the weekly basis chart of the U.S. dollar and immediately sees: RETURN TO RESISTANCE, MASSIVE DOWN TREND. This sums up the thinking explained above (except for the fact that the traditional chartist does not know why the pattern works. He only knows that it does work).
As you know, when the U.S. dollar falls, gold is highly likely to rise. Even better, since every country in the world is depreciating its currency (against real goods), their currencies may be rising against the dollar, but they are falling against gold. We can therefore say that the corresponding rise in gold is going to be enormous.
The final scientific principle, after one has discovered the new facts and related them via cause and effect, is to test one’s theory by predicting the future behavior (of the markets). In this regard, technical analysis has it way over fundamental analysis. Fundamental analysis just does not work. It seems that it ought to work, but it fails again and again. Each time the fundamentalist picks himself up and says, “There is nothing wrong with fundamentalism itself. It was only my analysis which was faulty. I just have to do a better job next time. Every once in a while he gets lucky, and this reconfirms him in his foolishness.
When I was young and had just turned bullish on gold (circa 1970), I spotted the pull back to support (the reverse of the pull back to resistance which is now occurring in the dollar). I picked a small Canadian gold mine (Lake Shore Mines) as my play. The company was making no money. The price of gold was so low that revenues were below costs. It ceased operations, and the mine was allowed to flood. It had virtually no assets. But I knew that the coming rise in the price of gold would bail all this out. The company was cheap, and it had the expertise to find new gold when the price had risen enough to warrant reopening.
The play, of course, worked out. But it took much longer than I had anticipated. I thought, here I had been right, but all that impressed me was that I was only making a small amount of money on a per annum basis. Finally, in 1979, Lake Shore took off, and I realized my mistake. The gold buyers in the early part of the decade were very timid. They listened to the propaganda from the (anti-gold) media. When they did buy, they could only summon up the courage to buy the safe, conservative mines. It was only when confidence returned that they were ready to try the most speculative mines.
I realized that there was a phenomenon called market mood. Sometimes traders were confident and bought the risky stocks. Sometime they were timid and bought the safe ones. That is, there was a principle of market mood. Whether the market mood was confident or timid would determine which group performed best. This market mood, of course, had nothing to do with fundamentals. It was a principle of psychology (and fundamentals have nothing to do with psychology).
Had I understood this principle early on, it would have brought definite benefits. Here in the second upswing of the commodity pendulum I am first making my play in the safe gold stocks and will only shift over to the risky ones when the technicals tell me to. You have seen many articles on this web site pushing the smaller, more speculative gold mines and predicting that their day will come. This is true. At some future point, their day will come. And I will know this day by the technical action in the charts. The speculative mines are already a solid fundamental buy and have been so for a long time. But they have been getting killed since 2007. (Check the CDNX.). This is why I am making money in the gold stocks, and many other gold analysts are not.