Re: Time to Buy more Silverado Shares ?
in response to
by
posted on
Jun 24, 2009 11:46AM


Silverado Chart update-
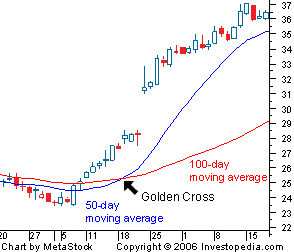
As I mentioned in my previous post, that the 20 day and the 50 day moving average line has moved much higher. The 20 day has made the "Golden Crossing" above the 200 day moving average line. The 50 day moving average line is about one week to two weeks from making the "Golden Crossing" above the 200 day moving average line; this will mark a major event when it does make the crossing because all the work by the short sellers to turn the chart upside down to keep investors out, will have been complete reversed to a positive picture that will attract big momentum players to take a closer look at silverado stock. Lets see how the market forces play out.
As I mentioned earlier, I'll try to post a chart by this weekend, for now, I would suggest for those who want to learn more about what a "Golden Crossing" means to visit Investopedia web page that explains the "Golden Cross" and has many more definitions for investors to learn about to get started on how to read charts and the language.
http://www.investopedia.com/terms/g/goldencross.asp?viewed=1
