Silverado Daily Chart "The Golden Cross" A Convergence
posted on
Sep 28, 2010 12:32AM


Silverado Daily Chart updated Monday evening, Septemebr 27
Like I had hoped, the 20 Day Moving Average line (MA) and the 200 (MA) both sevrve as the new price support for the past week. Note that both the 20 and the 200 (MA) have converged on the same point on the price chart at .005 A pennant flag has been forming with the point of the flag narrowing to a trading range between .0052 to .0054 the past week building good support for the share price above the MAs
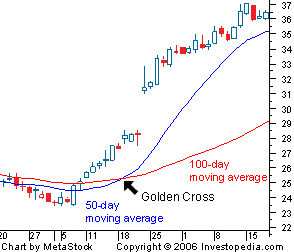
A "Golden Cross" could happen any day with the 20 (MA) moving above the 200 (MA)
Silverado Daily Chart Link http://www.freeimagehosting.net/uploads/7ba8d4e11d.jpg
$$ Ka-Ching Ka-Ching $$
It will be interesting to see how this plays out on the daily chart over the next few weeks. Keep in mind that Weekly charts are built on the back of Daily Charts.
~~~~~~~~~~~~~~~~~~~~~~~~~~~~~~~~
Golden Cross Definiton
The golden cross is a chart pattern created when a shorter term moving average was below a longer term moving average, but it crosses above that moving average. This is typically seen as a bullish signal.

As long-term indicators carry more weight, the Golden Cross indicates a bull market on the horizon and is reinforced by high trading volumes. Additionally, the long-term moving average becomes the new support level in the rising market.
Technicians might see this cross as a sign that the market has turned in favor of the stock.
~~~~~~~~~~~~~~~~~~~~~~~~~~~~~~~~
DEFINITION FOR PENNANT FLAG
A Pennant (Flag) follows a steep, or nearly vertical rise in price, and consists of two converging trendlines that form a narrow, tapering flag shape. The Pennant shape generally appears as a horizontal shape, rather than one with a downtrend or uptrend. This behavior appears on a price chart with the initial price spike forming what technical analysts refer to as the "mast" of the Pennant, followed by a triangular pennant shape [to the right].
Underlying Behavior
This pattern is effectively a pause in an uptrend. The price has moved ahead of itself with a steep rise; therefore market activity takes a break before continuing the uptrend. This pause is reflected in the decreasing trading volume. Similarly, a spike in volume marks the resumption of the uptrend.
Volume
As the Pennant develops, the volume tends to decrease. Martin Pring notes in his book, Technical Analysis Explained, "a pennant is in effect a very small triangle. If anything, volume tends to contract even more during the formation of a pennant than during that of a flag." However, as with Flags, when the Pennant completes you will often observe a sharp spike in volume. Duration of the Pattern
In his book, Technical Analysis of the Financial Markets, John J. Murphy identifies that Pennants and Flags are relatively short-term and should be completed within one to three weeks". He also notes that by comparison, the bullish patterns take longer to develop than the rellated bearish patterns.