Re: Filling the Gap
in response to
by
posted on
Sep 30, 2010 12:19PM


Fibonacci Retracement is sometimes refered to filling the gap.
~~~~~~~~~~~~~~~~~~~~~~~~~~~~~~
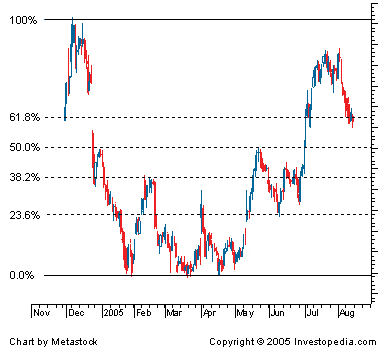
Fibonacci retracement is a very popular tool among technical traders and is based on the key numbers identified by mathematician Leonardo Fibonacci in the thirteenth century. However, Fibonacci's sequence of numbers is not as important as the mathematical relationships, expressed as ratios, between the numbers in the series. In technical analysis, Fibonacci retracement is created by taking two extreme points (usually a major peak and trough) on a stock chart and dividing the vertical distance by the key Fibonacci ratios of 23.6%, 38.2%, 50%, 61.8% and 100%. Once these levels are identified, horizontal lines are drawn and used to identify possible support and resistance levels
For reasons that are unclear, these ratios seem to play an important role in the stock market, just as they do in nature, and can be used to determine critical points that cause an asset's price to reverse. The direction of the prior trend is likely to continue once the price of the asset has retraced to one of the ratios listed above. The following chart illustrates how Fibonacci retracement can be used. Notice how the price changes direction as it approaches the support/resistance levels.

In addition to the ratios described above, many traders also like using the 50% and 78.6% levels. The 50% retracement level is not really a Fibonacci ratio, but it is used because of the overwhelming tendency for an asset to continue in a certain direction once it completes a 50% retracement.