Rising Interest Rates are Excellent for Gold (Mark J. Lundeen)
posted on
Sep 11, 2009 04:02AM


12 June 2007
The entrenched financial establishment seldom passes an opportunity to cast their gloom upon the gold market.
``As interest rates go higher and higher, it makes the purchase of any commodities, which never pay interest or have yield, a poor judgment,'' - Leonard Kaplan, president of Prospector Asset Management, a money-management company in Evanston, Illinois. 07 June 2007.
What he based this opinion upon is a mystery to me. There is good reason to suspect that he has never spent any time actually studying the history of the gold market. The multi-decade-long relationship between bond yields and gold is very clear: bull markets in gold are rising interest rate environments. Gold investors historically have prospered when interest rates rise. History also tells us that the time to sell gold and buy bonds is when interest rates are declining.
Dissecting Mr. Kaplan's comments I find three hypotheses which can be tested using historical market data:
1) Increases in interest rates make debt more attractive and gold less desirable. This would make the value of gold, like bond prices inversely related to movements of AAA debt yield.
2) Debt yields dollars for income, gold collects dust. Mr Kaplan believes that generating income is the prime consideration for conservative investment funds. He sees inflation risk to principal a non-factor in the current regulated financial market place.
3) Interest rate volatility drives the gold market. This implies that changes in yields are actions; while changes in the gold market are reactions to interest rates.
In Part 1, of this article I will address the first two points. In Part 2, I will write about the third.
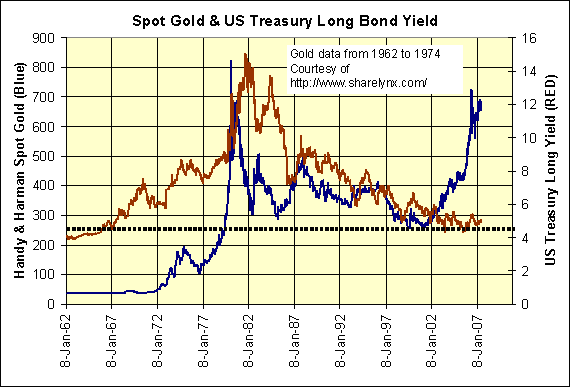
Below I have plotted gold with the US Treasury long bond yield going back to 1962. Let us examine what are the actual relationships between gold and high grade bond yields. We can test the above 3 hypotheses using the data below.

1) Increases in interest rates make debt more attractive and gold less desirable. This would make the value of gold, like bond prices inversely related to movements of AAA debt yield.
From 1962 to 1999 (37 years) this is a false statement. For these thirty seven years there was a clear and direct relationship, if not a proportional relationship between US Treasury long bond yields and the price of gold. Rising gold = rising bond yields; falling gold = falling bond yields. At times a significant time lag between the two exists, but the relationship is clearly on display in the above chart.
Note that gold was "fixed" at the official US Government price of $35 an oz in the early to late 1960s. But also realize that this was the period of the London Gold Pool (LGP) whose sole purpose was to prevent gold from rising above $35 an ounce. If the market price of gold was stable at $35 there would have been no need for the LGP. It is reasonable to assume that if no official government intervention in the gold market was present, and had gold been allowed to find its own price unimpeded, the gold plot in the above chart would have continuously tracked interest rates from 1962 to 1980.
The period from 1999 to 2007 (8 years) are the only years of the forty five years plotted that justify Mr. Kaplan's point that gold does best with falling bond yields. Using only 17% of the period from 1962 to 2007 he assumes that gold has no where to go but down. My comments on this will be found in Part 2 of this article.
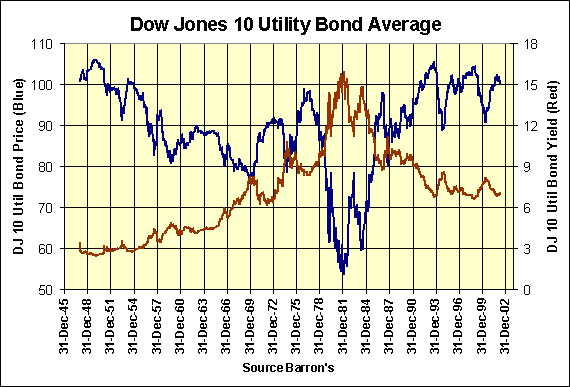
Below is a chart for the discontinued Dow Jones 10 Utility Bond Average series (DJUBA / December 1947 to April 2002). These were high grade investment quality bonds that money managers many decades ago sold to widows and orphans. When it comes to corporate bonds, utility bonds are the best in good and bad economies as they pay out their coupons from a safe and secure source of income. This is excellent data to examine bond prices under rising and falling interest rates environments as both plots; price and yield, are from the 10 utility bonds themselves.
When you compare the chart above with the chart below, it is undeniable that rising interest rate environments punished bond holders while rewarding gold investors from 1962 to 1981. It works both ways as falling interest rates from 1981 to 1999 punished gold investors and rewarded bond holders.

The DJUBA contained bonds of the highest quality whose only fault was that their principal and coupon were dollar based. I don't fault Long Island Power and Light for that. But bonds are bonds and these high quality bonds fell 45% from 1945 to 1981 due to the rising interest rate environment they found themselves in. It is noted that the DJUBA returned to it previous levels in 1993 and they paid without fail, dollars (taxable) with their coupons for the entire period. However when one considers the effects that inflation had on those dollars over the years, you can understand why bonds were called "certificates of confiscation" twenty seven years ago.

In September of 1950, the DJ 10 Utility Bond Average cost 105.6. It took forty three years for these bonds to return to their 1950 highs in September of 1993. But the 30 year old World War Two veteran who bought similar bonds in 1950, upon the advice of his investment advisor and held them until he became a 73 year old World War Two veteran lost over 80% of his original principal's purchasing power due to inflation. I based this calculation upon CPI. The low taxable coupon payments of around 3% from these bonds could never make good this loss. I believe that the current low bond yields paid to bond investor today is creating a similar situation for the 2007 bond holders due to the soon to be undeniable ravages of impending future inflation.
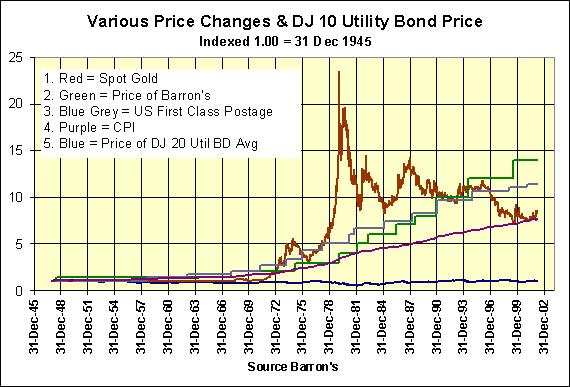
Look at the above chart. There are five items plotted, three of them are not investments but rather cost of living items. Only gold (post December 1974) and the DJUBA were investment vehicles that people bought with expectations of gaining future wealth with the purchase. The DJUBA is the blue line at the bottom of the chart. Even after the huge 1980 to 2002 bull market in bonds, high quality AAA rated bonds did not protect the 1950 seekers of conservative investment from the ravages of inflation. This was not the case with gold, look at the chart. It is a fact that where the bond bull market of 1980 to 2002 never rose up to CPI, the gold bear market of 1980 to 2002 only fell down to CPI. After the 1980 to 2002 bear market where gold fell 70% from its 1980 highs it still protected its owners from the losses bond owners suffered from. Amazing!
As far as Mr. Kaplan's second hypotheses on bond yields and gold:
2) Debt yields dollars for income, gold collects dust. The prime consideration for conservative investment funds is to yield income. He sees inflation risk to principal a non-factor in the current regulated financial market place.
I can only refer you once again to the above chart.
Part 2: Action and Reaction. Do interest rates lead gold prices or do gold prices lead interest rates? Look at the first chart in my article. Gold is at near all time highs while bonds are only yielding rates not seen since gold was at $35. One has to wonder if something is afoot in the financial markets. Is gold blasting off half cocked on a journey to nowhere while bonds are enjoying the abundant blessings of structured finance? Maybe; and then maybe not. I'll give you my nickel's worth on this subject in part two.