Gold Stock Popularity - Nov 27/09 - Scott Wright (always interesting!)
posted on
Nov 27, 2009 09:15PM


Gold Stock Popularity
Scott Wright November 27, 2009 2862 Words
Gold’s amazing run since September has mainstream analysts, who are normally gold-haters, lauding its virtues. All of a sudden gold is now an integral asset that all investors should own. Why this quick shift of opinion? Big developments on the fundamental front (that did not come as surprises to informed investors like our newsletter subscribers), coupled with a run of 22 new all-time nominal highs, can change one’s mindset rather quickly.
Gold investment has grown very popular. Not only are we seeing increasing demand on the physical front via coin and bullion hoarding, but retail stock investors are directing more and more capital into the famous SPDR Gold Shares ETF (GLD). Large institutional investors have also participated in this trend. We’ve seen an elite hedge fund take a major stake in the world’s 6th largest gold depository (GLD). And even the world’s central banks have turned into net buyers of this yellow metal as seen in the latest World Gold Council report.
For a normally slow-moving commodity, a 24% run in just 3 months has garnered a lot of excitement. More and more investors are finally starting to understand the preciousness of gold. Whether for retail or institutional investment, it is an indispensible hedge to fading fiat currencies that are being inflated into oblivion.
Another exciting asset in the gold realm is the stocks of the mining companies that bring this metal to market. And we’ve definitely seen the gold excitement spill over into gold stocks. Since the beginning of gold’s secular bull in 2001, gold stocks have been one of the best-performing sectors in all the markets. But most of this run has been stealth to mainstream investors due to these stocks’ small market and lack of exposure. Those few contrarian investors who have been buying gold stocks since the beginning have seen extraordinary gains.
General gold-stock popularity and awareness has grown at a very slow pace. These stocks just haven’t received much face time in the financial media. And ultimately the onus has been on the investor to seek out the constituents of this sector. But a growing number of investors have indeed found gold stocks, and they have grown very popular in their own right. And all we need to do is look to the venerable HUI gold-stock index to gain a measure of this popularity.
The HUI is comprised of a basket of 15 unhedged PM stocks that best represent the gold stock sector. Since the beginning of the gold bull the utility of this index has proven invaluable in helping us trade gold stocks and better understand their markets. Not only has the action of the HUI allowed us to formulate reliable technical metrics that have guided us to profitable trading over the years, but HUI derived secondary measures have greatly helped us expand our analysis and understanding of these stocks.
One of these secondary measures is HUI volume. Now since the HUI itself is simply a tracking index, and hence doesn’t actually trade, it has no volume. But since its individual component stocks do have volumes, all we need to do is add them together to come up with a proxy for overall HUI volume. And this resulting HUI composite volume has given us some excellent insights into the gold stock world.
At Zeal we’ve spent many years accumulating and tracking this volume data in order to build this metric. And while anybody can pull historical volume data from the HUI’s current components and string it together for perhaps a general volume measure, it won’t tell the complete story considering the HUI’s radical composition changes over the years. Our in-house database contains true volume data including that of former HUI component stocks that have since been acquired and/or replaced. This provides a more accurate picture of historical HUI volume.
With HUI composite volume in hand, conventional volume analysis can be applied to what is representative of the gold stock sector. Now the reason this tool is not a primary measure in reading HUI technicals is its dual nature. Essentially, volume spikes can signal both greed and fear. Both of these emotions excite trading activity.
Higher volume episodes in isolation don’t necessarily reveal clear buy or sell signals. Price action and other technicals must be taken into account when determining what side of the sentiment spectrum a particular volume spike is associated with.
Low volume activity must also be considered in context. Periods of lower volume in an environment where volume is rising on balance typically translate to complacency and a general lack of enthusiasm. In many cases lower volume can signal interim lows, but not always. If you are interested in a little more technical depth on trading HUI volume, my business partner Adam Hamilton has penned an excellent series of essays on this topic.
In addition to general volume observations associated with recent HUI market action, my goal in this essay is to use HUI volume to highlight the growing popularity of the gold stock sector. And as seen by the recent popularity of these stocks’ underlying metal, there is no greater impetus for rising popularity than rising prices.

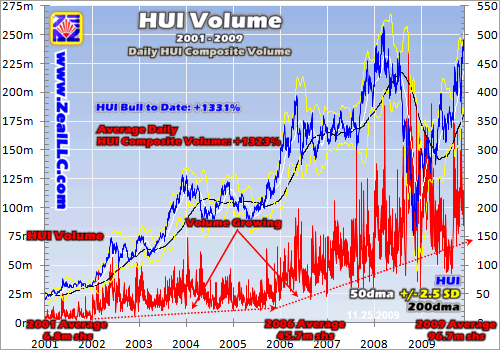
This first chart shows the performance of the HUI since 2001 along with its corresponding composite volume. The volume data, plotted in red, is simply calculated by adding up the raw daily volumes for each HUI component stock. And as you can see, back in 2001 gold stocks were not a very popular asset class. Even though the HUI gained 59% in a year where the flagship S&P 500 was down 13%, its average daily volume was only 6.8m shares.
Not only were most investors unaware of the existence of gold mining stocks, they were still caught up in tech-stock euphoria. Traders were clinging to their darling tech stocks even though they were in the middle of a steep correction off their apex from the year before. Only those few contrarians, like our newsletter subscribers, saw the beginnings of a secular stock bear and gold bull.
As time marched on, it was hard to ignore the spectacular gains that were coming out of the gold stock camp. And with more and more traders taking notice, HUI volume would greatly ramp up. In 2002 gold broke through $300, the HUI posted a staggering 123% gain, and HUI volume would more than triple to a daily average of 22.2m shares.
Indeed more and more shares were exchanging hands, but overall the HUI was still a relatively unknown index. Individual stocks on the big-board indices had average daily volumes that were many multiples higher than the volumes of all the gold stocks in the HUI combined.
Following the big HUI volume surge in 2002 there would only be modest volume growth over the next 3 years. The biggest volume days during this span occurred in early 2004, spikes that saw over 50m shares trade hands in a day. Interestingly all these volume spikes were heavily weighted on the sell side, occurring on big HUI down days.
Even though the HUI was up 91% from 2003 to 2005, average daily volume would only edge higher by about 7%. I suspect this was partially due to the cyclical stock bull taking some of the thunder away from gold stocks during this time. When the more popular big-board stocks are running higher, traders aren’t as likely to look for alternative investments. Big HUI corrections in early 2004 and early 2005 didn’t shine much light on gold stocks either.
It wasn’t until 2006 that gold stocks garnered a bit more mainstream popularity and volume really started to take off. The underlying metal of these mining stocks had a banner year that spawned huge volatility on the gold stock front. Gold decisively blasted through $500 for the first time in 25 years. It also shot through $600 and even $700 temporarily. All the excitement surrounding the physical metal naturally spread to the stock arena.
From its 2005 low the HUI experienced a massive upleg, off a low-volume spell, to its interim high in May 2006. By the time this upleg was exhausted the HUI had gained 137%. And volume would follow suit. More and more traders would take an interest in gold stocks, with the HUI’s average daily volume increasing by 93% year-over-year. And even though the HUI would consolidate again for awhile before it entered into its next upleg in August 2007, gold stock popularity would continue to grow. Average daily volume would increase by 37% in 2007 and then by another 51% in 2008.
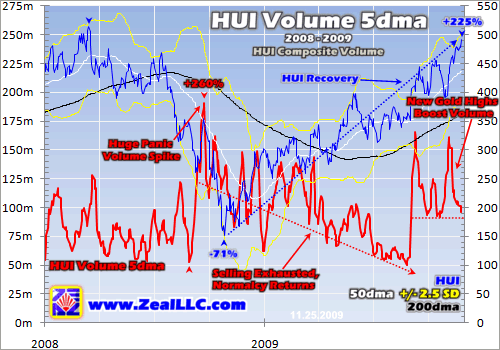
And it is this 2008 volume to current that I want to take a closer look at. With the HUI reaching its apex in early 2008 followed by a once-in-a-lifetime stock panic taking hold of the markets later on in the year, how did volume react? This next chart zooms in on HUI volume activity over the last couple years.

As you can see in the first chart, the raw volume data can be quite erratic on a day-to-day basis. A high-volume day can be followed by a low-volume day, which can create a lot of visual noise when trying to drill down on a tighter period of time. In order to smooth out this volatile volume data I like to use a 5-day moving average. With it averaging only the last week’s worth of data, the 5dma is restrained enough to still show volume extremes. Yet because it tames the wild day-to-day volume swings, the 5dma does give a much better visual.
In the first half of 2008 volume tracked closely with the HUI. Following this index’s March high it tracked on a downward consolidating trend. But when the rug was pulled from underneath the HUI in the second half of the year, traders reacted with ferocity. The average daily volume in the second half of 2008 was 32% higher than the first half. And looking at the performance of the HUI, this volume was heavily weighted on the sell side.
From its high the HUI plunged 71% before finally bottoming in October. The stock panic had its way with the gold stocks, and at around 150 the HUI had retreated to July 2003 levels. In the midst of this downward spiral you’ll notice a huge spike in volume. Even with the smoothing feature of a 5dma it is glaringly apparent. Interestingly, the highest volume days corresponded with both big up and down days in the HUI.
The first big volume spike occurred on September 9th, when the HUI was down 9%. And only 6 trading days later was the next when the HUI fought the panic with a gain of 12%. The volumes on these respective days were 177m and 224m shares trading hands, the latter an all-time record. A secondary period of high-volume days occurred in early October. On these days the volatile HUI had down days of 16%, 6%, 13%, and 9%, with an up day of 19% in between. Again, the volume spikes reflected both heavy selling and buying.
Following the volume spikes in September and October, HUI composite volume finally trended down to pre-panic levels. Selling pressure had been exhausted and many gold stock traders were out of the market for good after being burned so badly. This down-trending volume was heavily weighted on the buy side as evidenced by the HUI’s ongoing recovery.
After a summer 2009 consolidation that saw HUI volume drop to its year lows in August, the birth of a powerful gold upleg attracted renewed interest to gold stocks. And gold $1000 has proven to be a huge psychological boost to stock traders. HUI volume has been way up since September 1st, averaging 116m shares per day as the HUI claws back toward 500. The volume activity these last few months is expected to push 2009’s daily average to exceed 2008’s.
Overall when we zoom back out and look at the secular trend, there is one very clear conclusion that can be made. As goes the HUI, so goes its volume. The HUI gained 1331% from its November 2000 low to its March 2008 high. And provocatively, from full year 2001 to 2009, HUI volume has risen by nearly the same amount. But this 1323% rise in average HUI daily composite volume only tells part of the story on the popularity front. If we want to gain a clearer picture of investor interest in gold stocks, we need to consider capital volume.

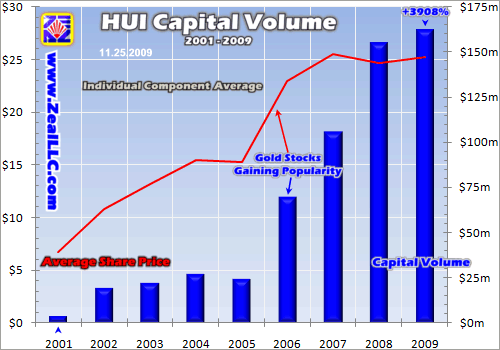
Capital volume is a way of quantifying volume in dollars. And with the availability of historical volume and price data, there are a number of different ways we can look at it. In the chart above I present it at an individual-stock level in order to see the capital volume of the average HUI component stock over the course of this bull. The calculation is simple, multiplying the average annual share price of HUI component stocks by the average annual daily volume.
As is apparent, in the early years gold stocks didn’t swing around very much capital. In 2001 the average HUI gold stock traded at $6.72 per share with an average daily volume of 603k shares. This is the equivalent of daily capital volume of only about $4.1m. In the subsequent years rising share prices naturally led to a higher HUI, and when volume is thrown into the mix we can gain a better understanding of the kind of money that was finding its way into the gold stock trade.
As mentioned earlier, 2006 was the breakout year for gold stocks. And capital volume was a big constituent of the coming-out party. With an average share price of nearly $23 and average daily component volume of about 3.0m shares, average capital volume skyrocketed to nearly $70m per day. This 189% increase over 2005 capital volume showed sharply growing investor interest in these once-unknown gold mining companies.
And the popularity of these gold stocks has continued to grow into 2009. So far this year the average HUI component share price is right around $25 with average daily component volume at nearly 6.5m shares. This average daily capital volume of $162m is a staggering 3908% higher than it was in 2001! Gold stocks have indeed grown in popularity, but there is a lot more room to run in this still-small sector.
To put the capital volume of the average HUI component stock in context, consider the average daily capital volume of these mainstream favorites so far in 2009. INTC - $1100m, USB - $528m, MCD - $553m, F - $421m, AAPL - $2900m, and CHK - $341m. To take this a step further, let’s compare the HUI’s full year 2008 cumulative capital volume to that of another market darling. And at $589b, all the gold stocks in this entire index had a capital volume of only about 80% of that of Google ($743b) alone. If gold stocks are ever to truly become popular in the mainstream, a lot more capital will need to find its way into this sector.
Overall this HUI volume data shows that gold stocks have grown increasingly popular. While day-to-day volume activity typically doesn’t provide tactical trading signals, this information does give us a better collective understanding of the world of gold stocks. We’ve seen big volume spikes amidst both greed and fear extremes, along with low-volume episodes that have often marked the beginning stages of another run higher. But ultimately in any bull market traders are drawn to performance. And HUI volume shows just that.
But even with the HUI and its raw and capital volumes on the rise, gold stocks are still not reflecting mainstream popularity. And for a variety of reasons they are not even reflecting the current price of gold. These mining companies are able to greatly leverage their profits to a rising gold price, and based on their inherent risks shareholders should see gains that well-outperform the underlying metal.
Gold stocks should have a lot more room to run at the current gold price and over the course of this ongoing secular bull. At Zeal our newsletter subscribers have been profitably trading gold stocks since this bull’s beginning, when we few contrarians were responsible for a large part of their small volume. And our subscribers are still sitting pretty with gold stocks today. Between our monthly Zeal Intelligence and weekly Zeal Speculator newsletters, our current outstanding gold-stock trades have average unrealized gains of 86%. Subscribe today to get one of the most well-rounded commodities newsletters on the planet!
The bottom line is even though gold stocks still reside in a relatively small sector, measured by raw and capital volume they’ve seen immense popularity gains. HUI volume has skyrocketed since 2001 as more and more traders are following the gains and recognizing the now and future potential of these mining companies.
Gold stock volume has steadily grown and will continue to grow. There are different catalysts that spark high-volume episodes, but whether greed- or fear-driven so far every occurrence has not hindered the uptrend. Even the panic saw some anomalous volume activity that may never be replicated, but the HUI has recovered and is nearing its highs once again.
Scott Wright November 27, 2009 Subscribe