stock direction
posted on
Jan 25, 2010 01:30PM

Edit this title from the Fast Facts Section

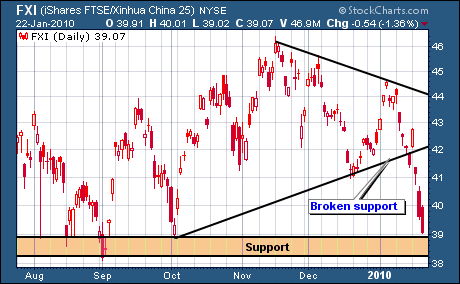
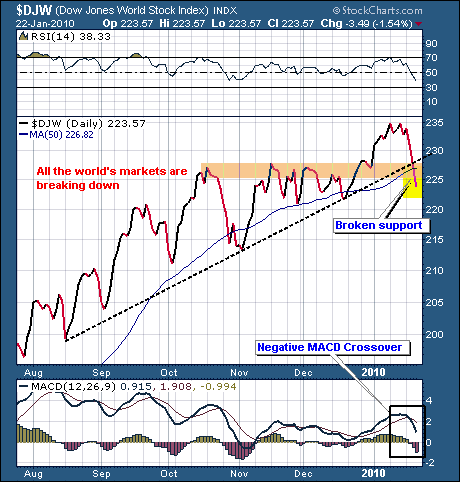
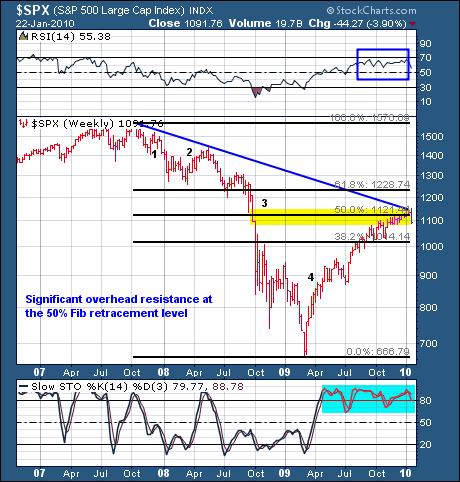
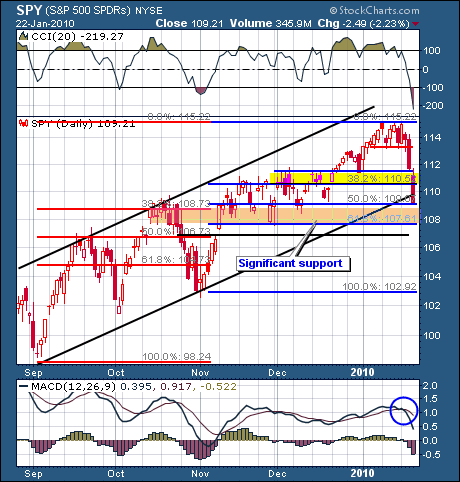
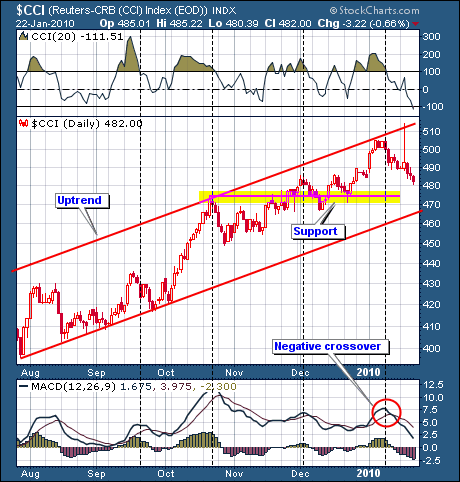
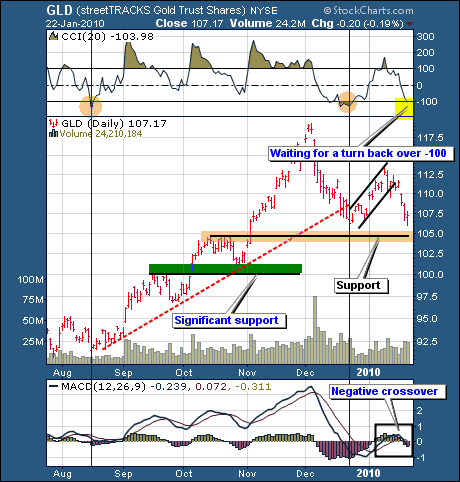
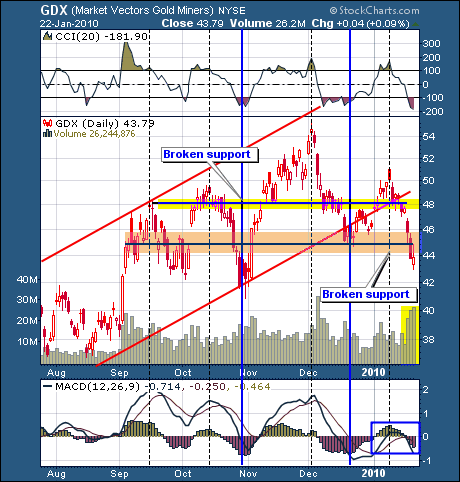
Week Ending 1/22/10 Stocks Last week's report started with China's announcement to raise reserve requirements for bank deposits. The news sent markets into a tailspin. China continued this week to lead world markets down. Downside momentum increased, spurred on by the President's comments on more regulation for Wall Street, which, needless to say, didn't sit too well with the boys. However, stocks were overbought and looking for an excuse to correct. They found one. The World Stock index shows that markets around the world are getting whacked. Trend line support has been broken, and the Dec. lows are coming up fast. U.S. stocks were down about 4% for the week. Last week's report discussed that the S&P 500 was bumping up into significant resistance marked by the 50% retracement of its entire 2008 decline. Coupled with the market's overbought readings, China's announcement to raise rates, Greece's bond debacle, and President Obama's remarks, and it was more than the market could bear. Now the question is - is this just a short term pullback, or is this the start of something more significant? The chart below shows 4 waves descending from the 2008 highs. It's possible that a 5th wave down of a secular bear market is still lurking in the shadows. I suspect it is. Up next is a daily chart of SPY. Overlaid on the chart are two sets of Fibonacci retracement levels: the blue lines are from the November lows up to the January highs; while the red lines are from the Sept. lows up to the Jan. highs. Note the intersecting levels between the two sets around 109, which is the 38% retracement out of the Sept. lows, and the 50% level out of the Nov. lows. Overlapping Fibonacci levels can mark important support areas, which have been highlighted. Prices have broken below their rising channel, and MACD is under a negative crossover - both suggesting lower prices. Commodities Commodities fell across the board with stocks and precious metals, leaving the dollar and bonds to carry the day. From last week's report: Note the black dotted vertical lines that connect CCI overbought readings that drop below 100, with the beginnings of past corrections and negative MACD crossovers at the bottom of the chart. We may be at one of those junctures now. Horizontal support is noted by the yellow band near 475, with further support offered by the lower diagonal channel trend line (460). The CCI commodity index got clobbered for the week, losing over 7%. The above still applies. Gold With the dollar rallying up, gold continued down, losing -3.38% for the week, so downside momentum lessened somewhat. The daily chart has price falling well below its rising flag and fast approaching the Dec. lows. If the Dec. lows are taken out, the next target is the Nov. low. MACD is under a negative crossover, suggesting more downside yet to come. However, CCI is below -100 entering into overbought territory. Look for CCI to enter back into positive territory for a sign of an impending rally. Gold Stocks Last week's report mentioned that it would be hard going for the gold stocks if both physical gold and the overall stock market corrected. Unfortunately, that is exactly what occurred, and the gold stocks responded in kind, dropping over 7.65%. The dark blue vertical lines connect oversold CCI readings to the start of past rallies; while the black dotted vertical lines connect overbought CCI readings with the start of past corrections. Price has dropped well out of its rising price channel and below lower horizontal support at 44, suggesting the Nov. low may come under fire. On the above GDX chart, MACD is still under a negative crossover and volume expanded on the decline. More downside is likely, although an oversold snap back rally is possible. It is interesting to note that several times in the past the GDX broke below diagonal trend line support and still came back to rally strongly and continue its bull market ascent. All the market did in the process was to shake the weak players out and allow the strong hands to accumulate more shares at bargain basement levels. Market Wrap

