James turk trading
posted on
Feb 04, 2010 11:53PM

Edit this title from the Fast Facts Section

Trading, Investing & Saving - Trading |
||||||||||||||||||||||||||||||||||||||||||||||||||||||||||||||||||||||||||||||||||||||||||||||||||||||||||||||||||||||||||||
|
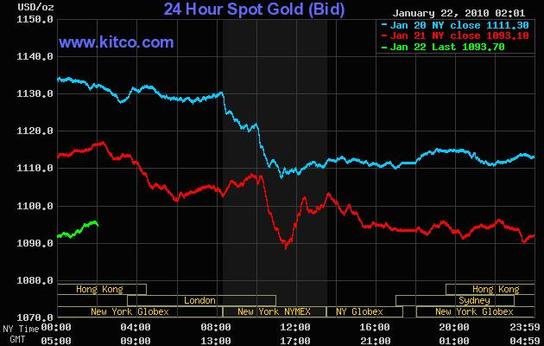
Trading and investing can be highly risky. Please read the Disclaimer. Current Trading Positions Comments, 4 February 2010 (posted 23h00 CET): Gold 2) The two position bought at $1104.30 on the February 1, 2010 were sold on February 4, 2010 at $1062.40, which was below their stop-out point. Loss: $83.80. Silver 2) The position bought at $16.202 on January 28, 2010 was sold on February 4, 2010 at $15.343, which was below its stop-out point. Loss: 85.9¢. Gold/Silver Ratio –The position (i.e., long silver and short an equal dollar value of gold) from 66.9, the spot Comex close on January 28, 2010, was unwound on February 4, 2010 at 69.2, which was above the stop-out point. Loss: 2.3 points, or 3.4%. Comex options (options are high-risk and therefore not for everyone) The two Dec’09 14.00 silver calls bought at $1.348 on May 4, 2009 and 68.5¢ on July 13, 2009 were sold on the Nov 9th Comex close at $3.481 for a $4.929 total per ounce profit ($24,645 total for Comex contracts) and rolled forward by buying two Mar’10 18.00 silver calls at $1.162. Hold these calls without any stop-out point - (updated 30 Jan 2010) Comments, 30 January 2010 (posted 18h30 CET): 2) I continue to believe that the low is now behind us. However, watch the stop-out points carefully. 3) If the market starts moving higher from here, as I expect, plan to buy on this strength to build a trading position. See the new positions and my recommendations below. Comments, 28 January 2010 (posted 15h30 CET): 2) Selling pressure may continue for one more day so that the shorts have a low gold and silver price for marking-to-market their positions, making their month-end balance sheets look better. But the worst for gold and silver I believe is now behind us. 3) The ‘black-box’ trend followers have switched from long to short, and the gold cartel used that opportunity to cover below $1100 their shorts established above $1120, enabling the gold cartel to earn a huge profit. As evidence, note the decline in open interest over the past few days as the short-term moving averages were broken. 4) It is difficult to recommend buying here. All of my experience has taught me not to trade against the short-term trend as determined by the short-term moving averages, all of which are pointing lower. However, this difficulty I am having is exactly the thinking on which the gold cartel feeds. But we need to put aside emotion and use logic. Therefore I recommend traders today start establishing new long positions as detailed below. 5) Long-term accumulators of physical metal should ignore the short-term trends and the fluctuations in price. Continue to accumulate physical metal through an ongoing metal accumulation program. Comments, 22 January 2010 (posted 09h35 CET): 2) Because of their success so far, we can assume that the gold cartel will now try to keep gold under $1100 until option expiry next week. Over 77% of the Feb Comex gold calls have been written at $1100 or above. All of these calls will expire out of the money if the gold cartel can keep gold under $1100 for a few more days. The gold cartel has a powerful incentive to do just that, given that they have written a lot of these calls and that their principal aim is to cap the gold price. 3) The gold cartel operates principally in the derivative ‘paper’ market for gold (i.e., forwards, futures, and options). Physical metal is used by them only sparingly because it is limited in supply. There is no limit to how much paper it can sell, so the gold cartel is most active after the physical metal closes for the day. Typically, little physical metal is traded after the London PM fix. The following Kitco chart shows unmistakable gold cartel action. Note the steep decline the last two days after 10h00 New York time (15h00 London time), which coincides with the conclusion of the London PM fix.
4) The selling pressure by the gold cartel through various gold derivatives ‘painted the tape’. But it also served another purpose. Much commodity trading is guided by computer algorithms aimed to identify the price trend. One does not need to be a rocket scientist to reverse-engineer these so-called “black-box” traders. Typically when the short-term moving averages are broken, these traders reverse their position. So yesterday a lot of them switched their gold position from long to short, which was the gold cartel’s objective. It gave the gold cartel the opportunity to cover the short selling they did around $1140 earlier in the week. The situation is described perfectly by John Brimelow: "The two decisive elements in Thursday's trading…were the revelation that Wednesday’s down $27.40 day only saw open interest down 1,160 lots (3.6 tonnes) and the timing of the heavy selling which drove gold down $16 in less than an hour after the $1,108.25 PM fix, and which also sliced $9.30 of gold in the very thin period between the floor close and 4PM. The open interest news strongly suggests that some serious short selling was around on Wednesday, while the timing of the selling on Thursday makes this a virtual certainty. No proceeds-maximizing seller would press the market at those times.” The gold cartel is not a “proceeds-maximizing seller”. It is a price capper. 5) Friday afternoons are notorious for gold cartel actions. After London closes, when US traders begin focusing on the weekend and when the day-traders and scalpers start heading for the beach during the summer and the ski-slopes during the winter, liquidity is very thin. That circumstance creates a unique opportunity for the gold cartel to take some ham-fisted steps with its arsenal of derivatives to ‘paint the tape’. Consequently, I would not be surprised to see more downside probing in late New York trading today. 6) The gold cartel is not all-powerful. Using its paper derivatives, they can only drive the gold price lower to a level at which the physical market steps in and willingly takes all of the available physical metal at the offered price. In the final analysis, it is the physical market that drives the gold price. Only time will tell of course but it seems that the physical market is willing to absorb anything available under $1100 per ounce. In short, the gold cartel will probably have a tough time pushing the gold price much lower. 7) Being a trend-follower, I am reluctant to recommend traders buy here, particularly with option expiry in a few days. I would like to see some base-building first. But it is clear that gold remains good value. As a consequence, long-term accumulators of physical metal should use this opportunity to buy gold at this relatively good price. 8) In my forecast for the gold price in 2010, I said: “In fact, it is likely that a floor has been put under the market around $1050, the price at which India made its recent gold purchase from the IMF, though I don’t expect gold to fall below $1080. Like 2009, the low point for gold will probably occur early in this year’s first quarter.” We are at that low point. We will see in the next day or two whether gold will drop to my forecast low of $1080. 9) What’s true for gold is basically also true for silver. The option expiry for silver this month is not large. But when gold swoons, so does silver but typically with much more volatility and greater swings. Therefore, silver probably has further to fall, and $17 is a reasonable target. 10) I was clearly wrong about the upside break-out happening this week. The gold cartel bought more time with its price capping antics. But the gold cartel has not changed the long-term trend toward a higher gold price. Once option expiry is behind us, we can start focusing once again on the resumption of the short-term uptrend, which will inevitably lead to the next upside break-out. Comments, 21 January 2010 (posted 09h00 CET): 2) Despite the apparent severity of yesterday’s decline, there was relatively little technical damage to gold and silver. Even the short-term uptrends remain intact. 3) For now I am reluctant to recommend buying here. We are seeing classic trading action by the gold cartel as they run the stops and try to turn the black-box trend followers from long to short. 4) If the gold cartel is going to achieve its objective, both gold and silver have to decline further. If the gold cartel fails in its objective, then we can expect a sharp short-covering rally. Let’s watch and wait developments for a day or two. Comments, 19 January 2010 (posted 10h00 CET): 2) It looks like the upside break-out will happen this week. My best guess is that each metal needs some more ‘backing & filling’ over the next two days to build a stronger base. However, an upside break-out could come at any time. 3) Look to buy both gold and silver on strength, if we get it, thereby adding to existing trading positions. 4) This break-out would be the first indication that gold and silver are beginning the next leg up in their bull market. The next step would be for the metals to probe over-head resistance at the recent high around $1218 for gold and $19.30 for silver. US Dollar Index: The position sold short at 83.97 on May 4, 2009 was covered on December 17, 2009 at 77.69, which was above its stop-out point. Profit: 6.28 points, or 7.5%. Long-term Core Positions Since March 23, 2001, we have been holding goldgrams as our Core Currency Position (i.e., liquidity - which is sometimes also referred to as one's "Cash Position" - is being held as goldgrams in GoldMoney). I continue to recommend the ongoing accumulation of physical gold bullion as one's savings. Note: Beginnning with Letter No. 272-10 published on October 20th, 2000, I have been recommending the ongoing accumulation of select gold mining stocks. The week gold cleared $500 in December 2005, I recommended in Letter No. 375 to continue this ongoing accumulation of gold mining stocks as long as gold was below $900. In Letter No. 414 in November 2007, I increased this limit to $1,500 because of the ongoing debasement and declining purchasing power of the dollar. For these same reasons, I may need to again raise this limit in the future, but for now, contrinue to accumulate those stocks in the following tables that are not on "hold". Once gold goes over $1,500, then it is time to stop accumulating, stand aside and happily watch the price appreciation of assets that were carefully and steadily accumulated when they were undervalued. In summary, I have been recommending and continue to recommend the dollar-cost-averaging of the stocks in the tables below that are not on "hold".
The following two stocks 'mine' oil in Canada's oil sands, and have been recommended because of their dividends.
|