SILVER ANALYSIS
posted on
Feb 05, 2010 12:33PM

Edit this title from the Fast Facts Section

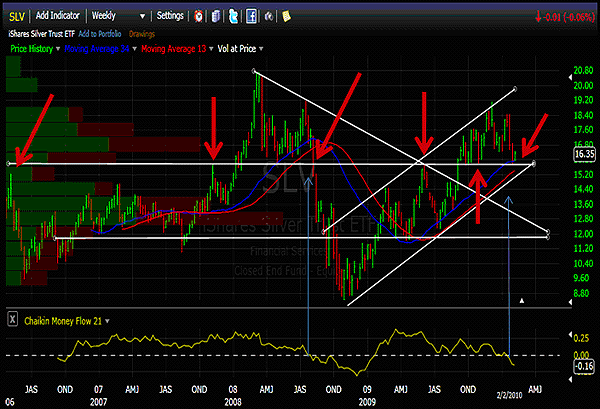
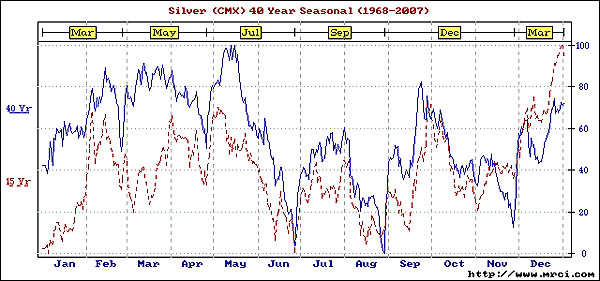
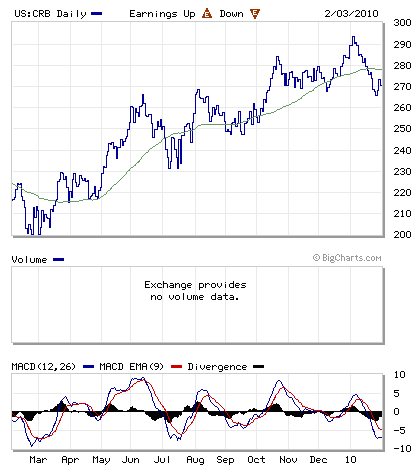
The price of silver was one of the big winners last year and the sentiment out there is for much higher price in the future. And that may certainly be the case. With all of the information out there it is difficult to not have a market opinion…………….and in other cases or perspective, it is difficult to HAVE AN OPINION. We all have our cherished views and bullish fervor on certain investments and the lure of $100 and $200 dollar silver must rank up there with the best of them. After all silver bulls have been saying for 30 years that we are running out of silver and the time has finally come for silver and gold to have their day. My interest in the precious metals is of the same fodder. I am in the camp that eventually gold and silver will have their place in the monetary and industrial world. The majority of the data we see is usually short and sometimes medium term time frames. The sell-off we saw in silver from 19.50 down to 16 dollars has a lot of investors asking and pondering the question of whether silver should be purchased here or not. Surely if silver was going to triple digit prices that now would be a great time to buy it. So I decided it was time to take a longer time frame look at the price of silver to see if it offers any clues as to direction. What I found was most surprising. The chart below is a chart of the most popular silver ETF called (SLV). It is from around the April 2006 time frame and represents close to 4 years of data on the silver price. (The ETF trades a bit lower in price than spot but does a great job of following it). What was most striking is that if you look all the way over to the left of the chart in late May 2006 we see that the price of silver was just below 16 dollars at its peak. Fast forward over to last week and ………………………………we see the same price, 16 dollars. We see the high of 2006 at 16 dollars, the high of 2007 at 16 dollars, the crash break price of 2008 was 16 dollars where silver plunged from, the June price peak of 2009 was 16 dollars and finally, the SUPPORT LOWS OF 2010 is the 16 dollar area. Observe all the red arrows on the chart and you will probably agree with me that the 16 dollar area for silver is the most important price area of the last five years. There is no other price in the last four years that has served as a better turning point. During the last 4 years silver has only been above the 16 dollar area twice - Once in 2008 for 6 months, and now this year, for almost 6 months. Therefore it is my conclusion that the turning point that must be watched is the 16 dollar area in silver. I want to now direct you to the bottom of the chart here where this oscillator measures money flow. Liquidity is the driving force of economies and financial instruments. Many say that love makes the world go round but I suspect in this day and age it has been replaced by liquidity. It must be the most important factor and must be what makes the world go round. At least this is what the government of the USA told us when it had to print a few trillion dollars. We were informed that if they didn't print that the world as we know it could stop and disintegrate. If you study the money flow indicator you will notice that I have drawn two blue arrows that show where money flow dropped below the zero line. The first time this happened silver dropped from 19 dollars to 8.50 and the major break took place at the 16 dollar area AND RIGHT AFTER SILVER FELL BELOW ITS BLUE AND RED MOVING AVERAGES. Now let's fast forward to today. Notice how we have achieved another penetration of the zero line. In fact if we look at money flow we can see that it has been dropping for quite a while now. Look how the same divergence was in place right before the 2008 crash. There is yet another fairly important indicator and that is the moving averages I use on this chart. Look at how well silver performs when it is above these moving averages and what happens when silver breaks these averages. Silver is still above those averages, but right now it is in a downtrend heading directly for those averages. Finally we have one more point and that is the main trend channel lines encompassing the entire run from 2008. We can already see that when silver touches the upper channel line that price comes down to the lower channel line for testing. Clearly this CHART is flashing a MAJOR WARNING THAT SILVER IS AT A MAJOR TURNING POINT in the 15-16 dollar area. It is at an area that has SEPARATED THE BULL AND BEAR MARKET MOVES IN SILVER for the past 4 years. How about the seasonal aspects of Silver? The chart below shows the potential for silver to have a sharp move down in the latter half of February and is entering a choppy pattern over the next few months where we should expect price drops. (See bottom dates for calendar…..top date for nearest futures contract) The analysis above is not a harbinger for you to sell all your precious metals. However it should serve warning that we are at a MAJOR INFLECTION POINT IN SILVER that needs to be watched carefully. Clearly we all have our cherished opinions and they have been hammered into to us over and over as not many are bearish the metals. And so far I haven't been either. What are we to make of it? When I showed it to my friend Kevin he said: 'it boggles the mind that silver is now priced lower than it was at this time 2-3 years ago......before the global meltdown, before u.s. dollar reserves were doubled, all the bailouts and red ink......." I think the conclusion we have to draw is that somewhere near this area silver is going to be a great buy or a sell. There is enough information out there to draw either conclusion. The Internet is a great information place, but it also can provide information to suit your OPINION. This week I read some great articles on the bullish prospects for gold and silver and I don't doubt them. However it is always important to remember that regardless of what you're told, no one knows tomorrow's price. We may have opinion but none know for sure. If it were so, the Greeks would have cornered the Olive Oil market a long time ago. What we do know is that the Silver chart is warning that a MAJOR PRICE TEST AREA is the 15-16 dollar area for silver. While there is rampant bullishness for the future, the chart is telling us to pay close attention to this area. Should history repeat itself, the chart shows that a break of this important area could lead to a test of the 11.50 - 12.50 area where the lower channel lines are. That is what price did the last time we broke this price area when money flow was dropping. If the bull market is alive and well then Silver should hold the 15-16 dollar area and a new rally leg should develop. However the last 15 years have seasonally shown that the February time frame is a dangerous one for silver bulls. Should a major credit crisis develop again like it did in 2008 I think silver could be very vulnerable over a 3-6 month period. Should we get a drop to the LOWER major channel lines it would be a great buy spot. Silver is not the only commodity that has been going down. Note the CRB commodities index. In summary all commodity and stocks markets need to be watched carefully. The longer we get into this so called recovery the more the government numbers seemed cooked like Japan did in the 90's. While the fundamentalists will eventually get their way in most areas, the timing element of silver and gold and any other instrument can swing wildly to the opposite side during times of panic. There are a lot of bulls and very few bears in the metals. While I am a bull……………I'm keeping my eyes glued to the price areas I've described for silver. There is a time to speculate with capital and a time of preservation. A 100% run up in 14 months should have us at least watching carefully. Epilog For the majority of the time, silver's a great buy in the June/July timeframe and a good time to be light is the winter time. At www.goldtrends.com we follow the long and short term of silver and gold prices right down to the 60 minute chart. Why not click the link and drop by while registration is still not required to view the data. May you all prosper, Bill Downey
Silver's Most Important Price Point
![]() Bill Downey
Bill Downey
February 3, 2010
From a seasonal standpoint a case can be made that Gold and Silver usually make a price high this time of the year. Of course with the global situation many feel that the metals will continue higher and the risk is missing the boat ride by jumping out too soon. There is certainly a lot of data that can be construed as inflationary. The question when using fundamentals is always timing. The fundamentals usually do play out at some point. The paradox is of course that if the markets behaved with the fundamentals from a timing perspective then economists would be traders.
![]()


