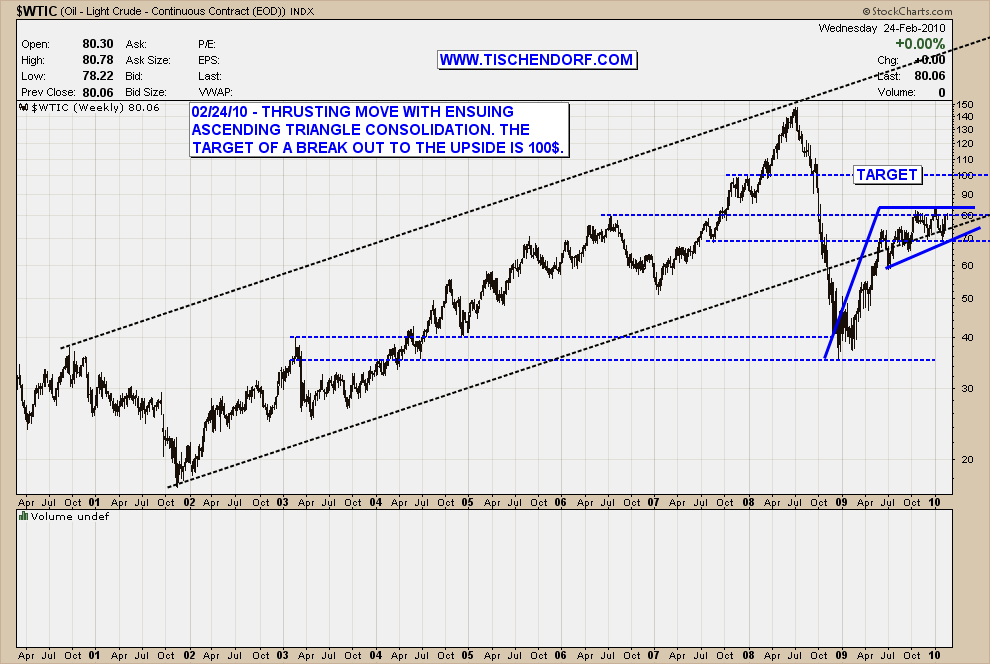
Just finished going through my public list and added annotations to several charts. The Light Crude Oil chart pattern is starting to draw my attention. Some 6 months ago I wrote about a false breakout move to the downside in oil. At that time I thought a 100 USD$ price target would be in the cards. Keep in mind this is a nice round number. From a psychological standpoint this is important as round numbers tend to act as price magnets. We are getting closer to a possible breakout and a 100$ price target looks quite feasible.
Price is holding up very well here. We witnessed a nice thrusting move that started last year and more recently the oil price consolidated forming a bullish ascending triangle pattern. A breakout would coincide with a separation move from the dotted black trend channel line.
Up-to-date Light Crude Oil Price Chart on my public list.
The shipping and oil tanker stocks are starting to look like they might move up soon as well. I am closely watching the whole sector. Check the Shipping Sector Overview Chart to identify leading stocks early on. Right now I like TK – Teekay Shipping. It looks like it is building up decent pattern pressure. The sector chart contains the following stocks:
- SEA – Claymore Global Shipping ETF
- FRO – Frontline
- TK – Teekay Shipping
- SFL – Ship Finance International
- OSG – Overseas Shipholding Group
- DRYS – Dryships
It ain’t what you don’t know that gets you into trouble. It’s what you know for sure that just ain’t so. – Samuel L. Clemens
Have a great evening!