
Klaus, this one is for you
posted on
Apr 01, 2010 07:39AM

Edit this title from the Fast Facts Section

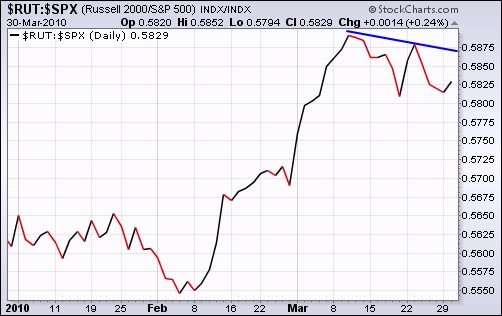
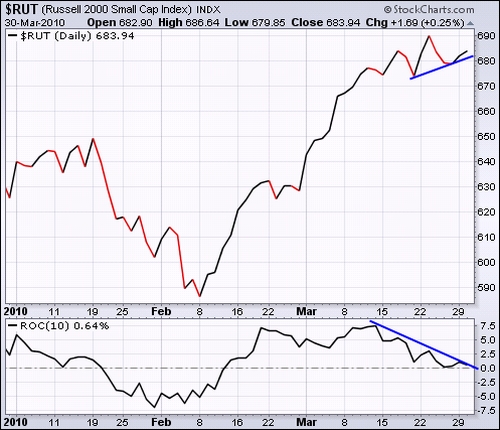
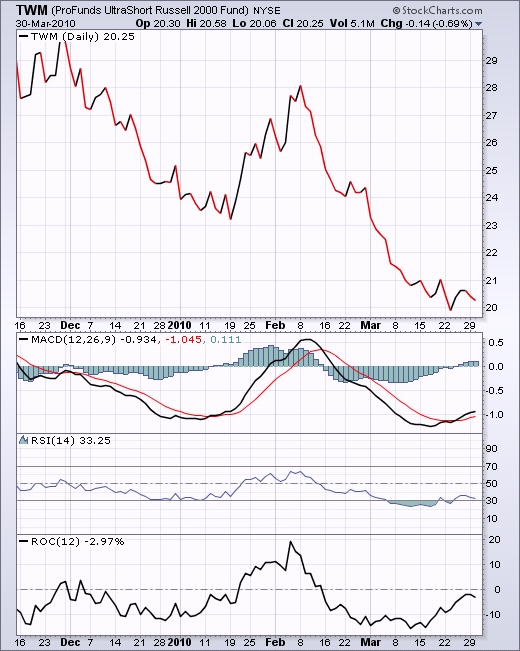
I posted a short article “Picture du Jour: Keep an eye on small caps” about 10 days ago, arguing that small caps, a leading performer since the lows of March 9 last year, seem to be tiring. This is illustrated by the relative chart of the Russell 2000 Index versus the S&P 500 Index below. (A rising relative-strength trendline indicates small caps outperforming and vice versa.) Source: Stockharts.com I stated that a few days’ underperformance was hardly grounds for drawing meaningful conclusions, but it is worth watching this space for a pointer regarding the overall market. What has since transpired is the Russell 2000 has been losing momentum fairly rapidly as seen from the ROC oscillator in the bottom section of the chart below, thereby creating a divergence with the price line. Source: Stockharts.com As food for thought in the previous post, I included a chart of the ProShares UltraShort Russell 2000 ETF (TWM), a fund that seeks daily investment results corresponding to twice (200%) the inverse (opposite) of the daily performance of the Russell 2000 Index. As shown in the updated chart, TWM has now confirmed a sell signal as far as the MACD oscillator is concerned. However, before concluding the most likely direction of small caps to be down (TWM up), and by implication that stocks in general could be hitting a headwind, the ROC and RSI indicators also need to confirm the signal. As always, I will be watching this space – even from Santo Domingo where I find myself at the moment. Are Small Caps Getting Tired?
 About the author: Prieur du Plessis