
Silver Surges to $18.68/oz Breakout Could Lead to March 2008 Record High of $20.
posted on
Apr 30, 2010 02:46PM

Edit this title from the Fast Facts Section

Commodities / Gold and Silver 2010 Apr 30, 2010 - 08:21 AM
By: GoldCore

 Gold reached new 2010 high in dollars (over $1,175 per ounce) in Asian trading overnight and again Europe this morning (over $1,177 per ounce) as investors continue to allocate funds to gold in order to hedge sovereign debt contagion risk. Gold was marginally lower in dollar terms yesterday but rose sharply in Asian trading with unusually strong Japanese buying and this buying has continued in early European trade.
Concerns of a meltdown in European debt markets have abated somewhat but gold’s continuing strength in euros and other currencies signals that the worst may not be past. Gold slow and steady rise continues and gold is up some 6% in April alone. Market sentiment towards gold has definitely shifted and gold’s safe haven asset attributes are now being accepted by even the most bearish gold analysts. Gold now looks good both fundamentally and technically having closed above $1,165/oz and with the trend firmly up, $1,200 per ounce seems quite likely next week.
SILVER
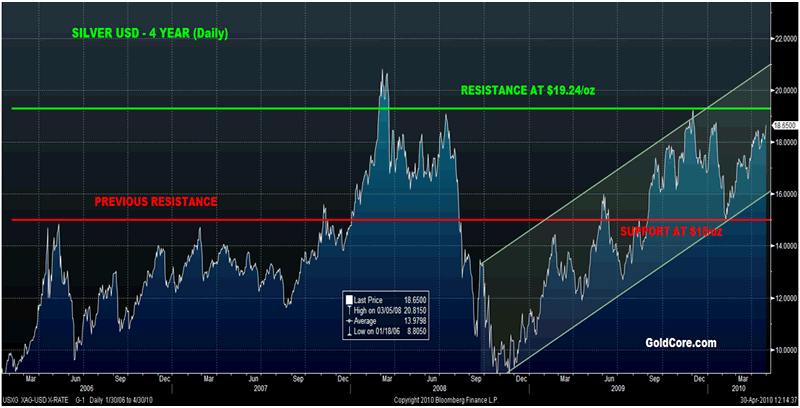
Silver surged 2.4% yesterday and traded higher throughout most of trade in New York and ended near its late session high of $18.56. Silver is up by more than 3% so far in the week and 8% in April. Silver looks very well technically (see chart above) and is in a rising trend channel with support at $15 and $16 per ounce. Resistance is between $19.20 and $19.30 per ounce and a close above these levels should see rapid price moves to $20 per ounce and above that the next level of resistance is at the March 2008 highs at $20.81 per ounce.
Indeed, it is interesting that after a similar period of consolidation in 2006 and 2007 below resistance at $15 per ounce (see chart above), that once resistance was taken out, silver quickly rallied nearly 50% in less than 3 months (from $14/oz to nearly $21/oz). In recent years, silver has tended to lag gold prior to sharp moves up after gold has already made significant gains.
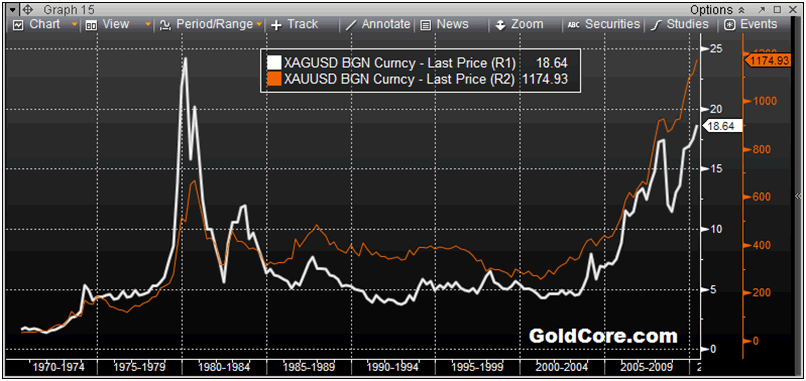
Silver Versus Gold Performance - 1970 to Today (Quarterly)
The chart above clearly shows how silver is extremely correlated with gold. Silver too is a safe haven asset and besides its very significant commodity uses it continues to trade like a currency. Despite, it being demonetized in recent year, Milton Friedman, said of silver "The major monetary metal in history is silver, not gold.” Gold and silver has been used as money in more regions and countries and for longer periods of time than the relatively modern use of paper currencies. Interestingly, silver has been used in more regions and countries and for longer periods of time as money than gold.
Gold’s record high in March 2008 was just over $1,000/oz and today gold is trading over $1,175/oz. So silver is in effect playing catch up with gold. But silver remains very undervalued versus gold on a historical basis. The chart above shows how silver has underperformed gold historically and in recent years.
Gold / Silver Ratio - 1960 to Today (Quarterly)
Silver remains very undervalued on a historical basis vis-à-vis commodities, precious metals and gold. The gold/silver ratio remains favourable to silver at 63 ($1,175/oz divided by $18.63/oz) and is falling. "Poor man's gold" remains far from recent record highs and long term record (nominal) highs near $50/oz in 1980 (see chart below).
Silver could be the surprise outperformer in 2010 as it was in 2009. Silver's industrial uses should mean that the gold/silver ratio will likely gradually regress to the average in the last 100 hundred years which is around 45:1. If the tiny silver market was to see real funds enter it than the ratio could return closer to the historical average of 15:1 as it did as recently as in 1968 and in 1980, this could result in silver surpassing its 1980 nominal high at $50/oz
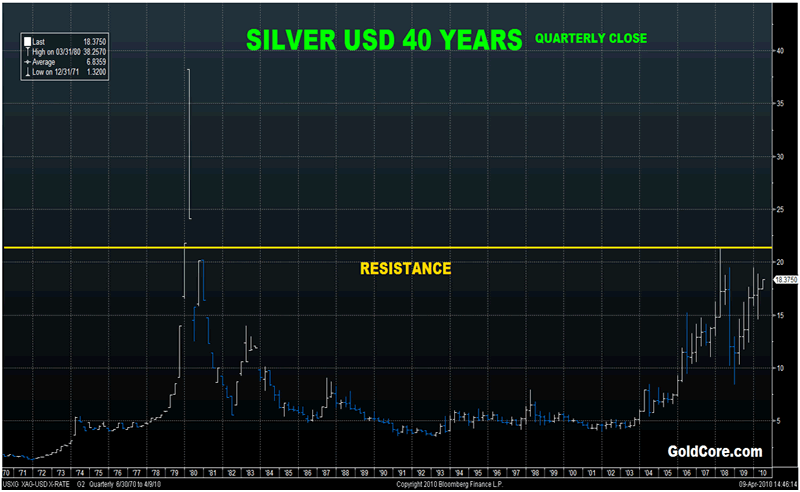
Silver reached $50 briefly in 1980 when just one billionaire Bunker Hunt (one of a handful of billionaires in the 1970’s) attempted to corner the silver market causing the price to surge (in conjunction with many investors seeking to hedge themselves from the stagflation of the 1970’s). Today there are hundreds of billionaires throughout the world. A lot of technical orientated analysts, investors and hedge funds are looking at this figure and as nearly all the other asset classes and commodities are at or recently reached all time record highs there is every reason that silver will do likewise in the coming years.
Silver is priced at some $18.70/oz today. The average nominal price of silver in 1979 and 1980 was $21.80/oz and $16.39/oz respectively. In today’s dollars and adjusted for inflation (government historically adjusted CPI) that would equate to an inflation adjusted average price of some $60 and $44. It is for this reason that we believe silver will be valued at well over $50 in the next 2 to 3 years.
Silver remains very undervalued vis-à-vis gold and remains a contrarian play with little or no media coverage and little or no retail investors having any allocation to silver whatsoever. A close above $21/oz could see silver quickly rise to $25 or $30 per ounce.
PGM’s
Platinum is trading at $1,742/oz and palladium is currently trading at $558/oz. While rhodium is at $2,850/oz.
This update can be found on the GoldCore blog here.
Mark O'Byrne
Director