
Justifying Dow 8,500 Before Dow 11,500
posted on
May 04, 2010 08:47AM

Edit this title from the Fast Facts Section

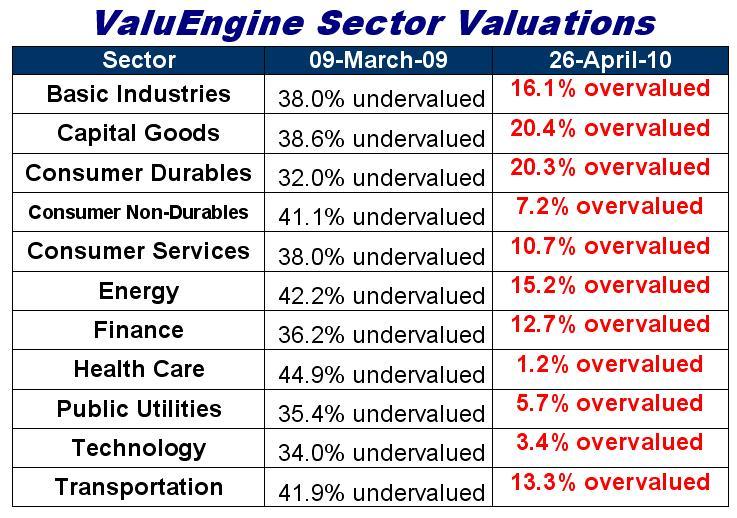
Stocks are fundamentally overvalued. The weekly and monthly charts for the Dow Industrial Average are overbought. Major technical levels are providing resistances. Stubbornly low US Treasury yields are a “flight to quality”. The rally in gold tracks the weak euro as “currency of last resort”. Weakening copper prices questions the global economic recovery. Making a Bearish Market Call is not Very Popular -Mixing fundamental and technical analysis is like trying to mix oil and water. -I believe that stock screening of fundamental data and viewing chart patterns are equally important in measuring the risk / reward of the stock market. -A stock becomes more fundamentally positive when the price of the stock goes down, and less fundamentally positive as the price goes up. -When the price of a stock trends higher the technicals are improving, and when the price is declining the technicals are deteriorating. The Bear Market of 2007 - 2009 My first warning came prematurely on March 1, 2007 when I called for Recession in 2008 / 2009, and that stocks would be in a bear market by the end of 2007. My reasoning was that you cannot have a bull market for stocks with a bear market in Housing and Financials. Today I see a double-dip in housing and there are still problems in the banking system. In October 2007, I said that the Dow will not sustain gains above 14,000. I said, “Beware of the Ides of October, as solid gold earnings are factored into Dow 14K”. I predicted that the next 2000 points would be down not up. The ValuEngine Stock Valuation Model focuses on the following variables A company's trailing 12-month Earnings-Per-Share Analyst consensus estimate of the company's forecasted 12-month EPS The 30-year Treasury yield. These variables are combined to create a more accurate reflection of a company's Fair Value. Back on March 9, 2009 every sector was extremely undervalued, but at the April 26th highs all eleven sectors were overvalued. These types of configurations helped me time the major bottom in October 2002, the market high in October 2007, and the lows of March 2009. (Click chart below to enlarge)
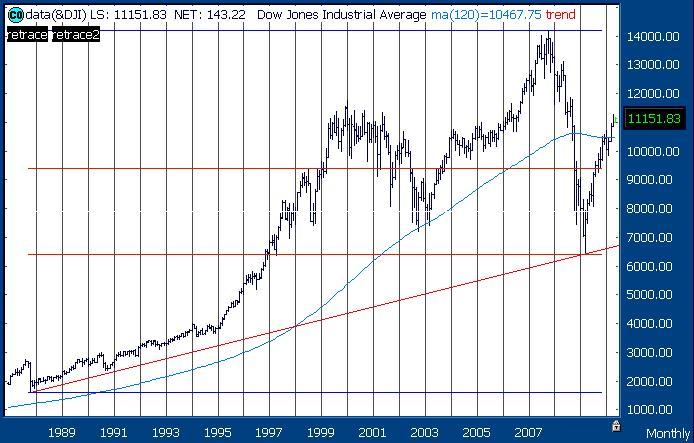
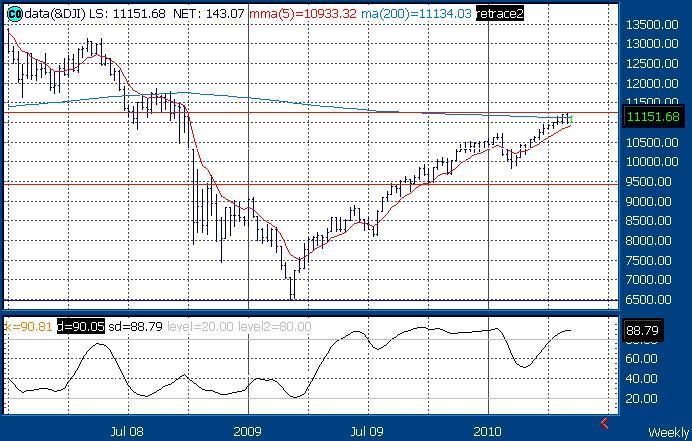
Chart Courtesy of Thomson / Reuters The monthly chart for the Dow Industrial Average showed me the bottom in March 2009. I looked at the up trend that goes back to the low following the Crash of 1987, and that trend was being tested. I drew the Fibonacci Retracement Levels and it was testing the 61.8% retracement of the entire rally from the 1987 low to the October 2007 high and that level was being tested. The weekly chart for the Dow Industrial Average is showing me the potential market top now. I drew the Fibonacci Retracement Levels between the October 2007 high and the March 2009 low and the 61.8% retracement was tested on April 25th. The Dow could not sustain gains above its 200-week simple moving average at 11,134. My annual and semiannual risky levels are 11,235 and 11,442 contained the high of 11,258. My Market Call Has Been: Dow 8,500 Before 11,500. Click to enlarge:
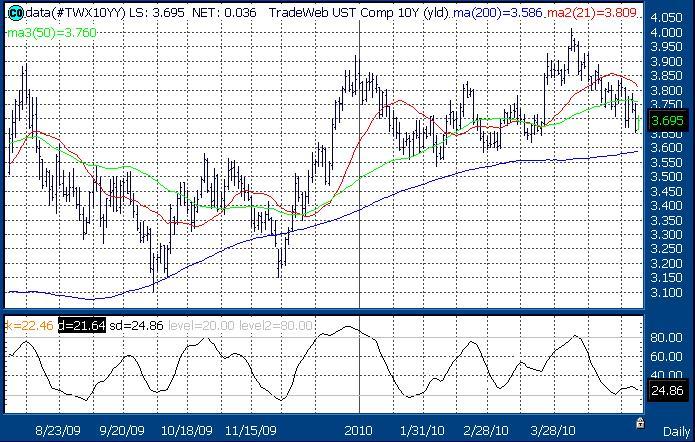
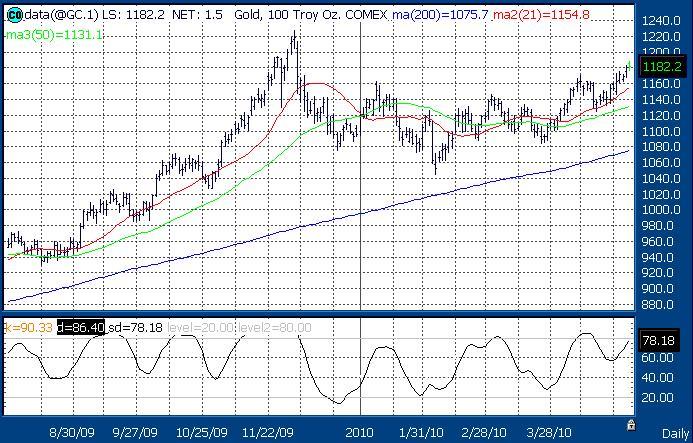
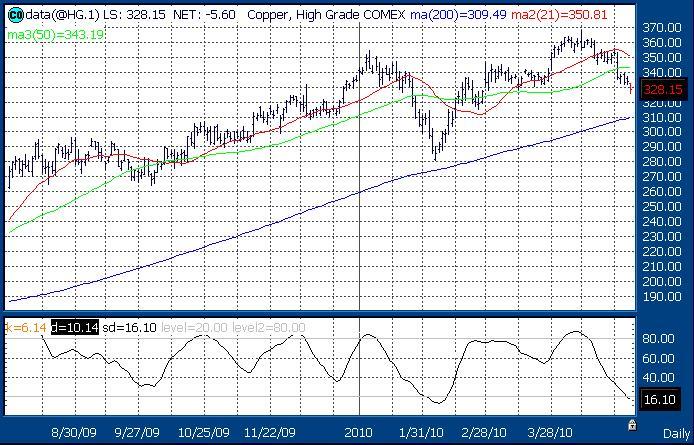
Chart Courtesy of Thomson / Reuters Low US Treasury yields reflect a “flight to quality”. Sure, supply has been a concern, but when it comes to bid time buyers are there for the safety of U.S. Treasuries. The yield on the 10-Year traded as high as 4.01% on April 5th, and then declined to my semiannual pivot at 3.675 with the 200-day simple moving average a resistance at 3.586. Click to enlarge: Chart Courtesy of Thomson / Reuters Higher Comex Gold reflects the precious metal as “currency of last resort”. A breakout above my semiannual pivot at $1186.5 targets monthly resistances at $1217.3 and $1270.1, as currency of last resort as the euro flirts with a breakout below 1.32. For the euro my quarterly support lags at 1.245. Click to enlarge: Chart Courtesy of Thomson / Reuters Lower Comex Copper reflects concern about the sustainability of the economic recovery. Copper is trading below its 50-day simple moving average at 343.19 with the 200-day as key support at 309.49. My annual resistance at 361.63 was tested at the April 12th high and my annual support is 283.51. Why is copper declining when the economy is projected to be this strong? Click to enlarge:
Chart Courtesy of Thomson / Reuters That’s today’s Four in Four. Have a great day. Disclosure: I Hold No Positions in the Stocks I Cover.
 About the author: Richard Suttmeier