gold & silver view
posted on
May 18, 2010 06:15AM

Edit this title from the Fast Facts Section

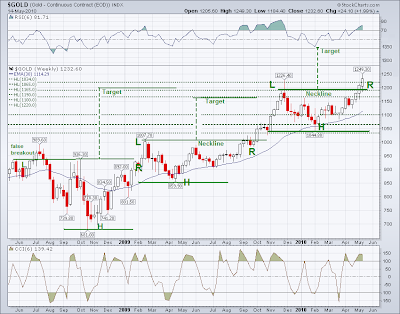
Both Gold and Silver bullion have inverse H&S formations 'working' on their weekly charts with the breakouts above their current necklines.
As is easily seen on the gold chart below, this bull market move is a series of inverse head and shoulders bottoming formation as the gold bull struggles to rise against determined shorting from the bullion banks. Each formation is more properly called a 'consolidation formation in an uptrend' rather than a bottom.
Gold is currently above the neckline which is around $1200. While it remains above this neckline, the target for this leg of the move would be $1350 as a minimum measuring objective.
If the price breaks below 1200 it is no longer an active formation, but it remains potential while the price is above 1044.
Silver is much more volatile than gold, with a significantly higher risk beta. This is important to note if you are using any sort of leverage, including miners that have a heavy exposure to silver.
Silver has a massive inverse H&S bottom, that is 'working' while it is above 18.80. The target for this move is around $30 per ounce. But it remains valid and potential while the price of silver is above 16.
If the price of silver falls below 18.80 then the formation is not active. 
The relationship between the miners and the bullion is leveraged, with a beta exposure to the SP 500. Further, gold is a more pure currency play than silver, which has a partial correlation to its industrial use.
It should be noted that in our opinion both markets are being subjected to significant manipulation by large short interests, which are particularly concentrated in the case of silver, and especially stubborn and 'official' in the case of gold, involving the central banks. This is our judgement based on the circumstantial evidence.
We also suspect that the Fed is buying across the US Treasury curve, but especially at the longer durations, and that the Treasury and Fed are working with one or more groups to support the equity markets primarily through the SP futures.
This adds quite a bit to the picture, although it is difficult to forecast since it is not natural market action and can distort the trends, but only in the short term.