Gold Is In a Classic Cup and Handle Formation Targeting 1,450
posted on
May 20, 2010 08:35AM

Edit this title from the Fast Facts Section

http://jessescrossroadscafe.blogspot.com/2010/05/gold-is-in-classic-cup-and-handle.html
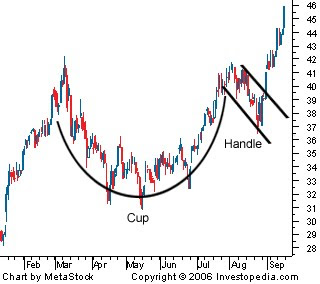
A "Cup and Handle" is a bullish continuation pattern in an uptrend.
The 'cup' is best shaped as a "U" and the broader the bottom the better. The 'handle' is a retracement when the right side of the 'cup' reaches its prior highs. The handle often resembles a bullish pennant.
The retracement usually does not exceed 1/3 of the advance of the cup to its second high, although it can go as deep as 1/2 in a volatile market.
Here is a textbook picture of a 'cup and handle formation' from Investopedia.
Here is the daily chart of Gold. It is in a classic cup and handle formation, with the handle having dropped down today near the 1/3 retracement target of 1183. A number of technicians have been watching it form. The advance to a new high, and the subsequent pullback, have made it now worth noting.
The handle has been shaping for four days from the peak at 1249.30. The handle generally takes from four days to two weeks to form before price advances again with fresh buying to retest the resistance around the prior high.
One might watch for the current Comex option expiration to pass next Tuesday, given the large concentration of calls around the 1200 level before gold can make its move higher. There is always the possibility of a counter squeeze, but it is difficult to fight paper with paper given the wide availablility of derivatives, and the laxness of regulation by the CFTC despite recent noises made about reform. Nothing has changed yet.
There is a possibility of a triple top, although this is why it is important that the cup have a broadly tested bottom.
The target for a breakout in this cup and handle formation above would be a minimum of 1450. The breakout should be accompanied by increasing volume. The more volume the more bullish the post breakout run will be.
This is consistent with the weekly chart which we posted a few days ago that shows an inverse H&S continuation pattern targeting 1350 as a minimum objective. In fact, one could draw the cup more conservatively, ignoring the intra-day spikes, and strike a target much closer to 1350.
What levels might be expected after the intermediate targets are reached?
My friend Brian at the Contrary Investor has produced a series of targets based on the prior high deflated by a number of measures. Here is one that I thought had a certain 'ring' to it. Keep in mind that M2 is a moving target, and moving lower for now. If it turns around and begins to expand again, the price could be much higher. But for now it is in a firm downtrend. So it conceivably could be lower.
Gold Deflated By M2 Projects to $3,912 to Match Its Prior High