under 4000?
posted on
Jun 10, 2010 12:43PM

Edit this title from the Fast Facts Section

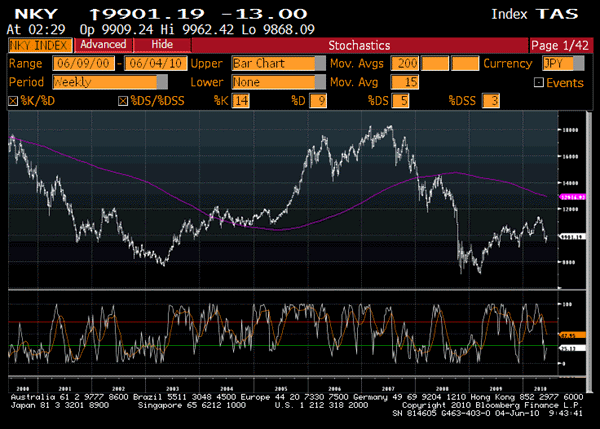
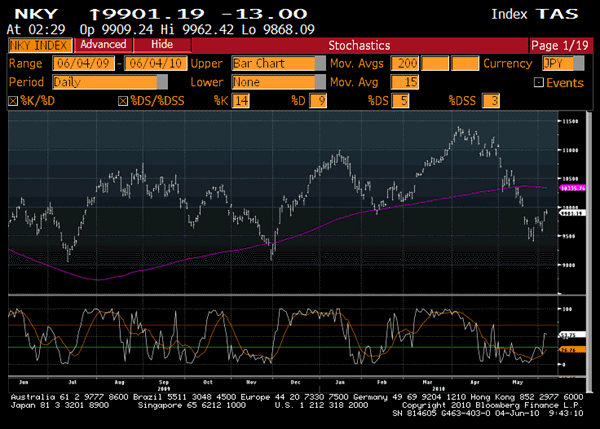
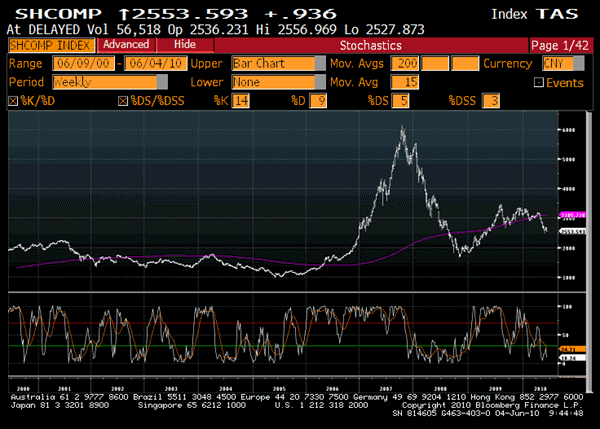
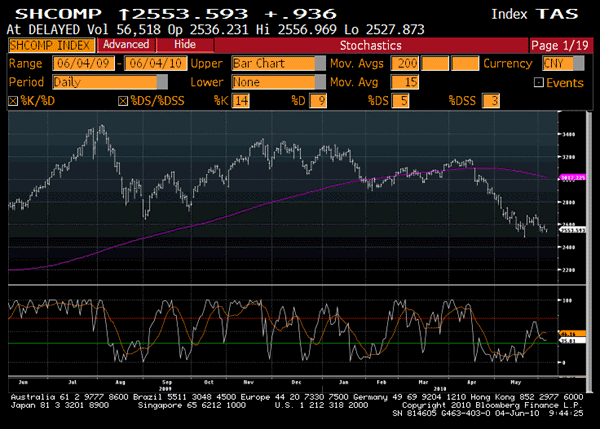
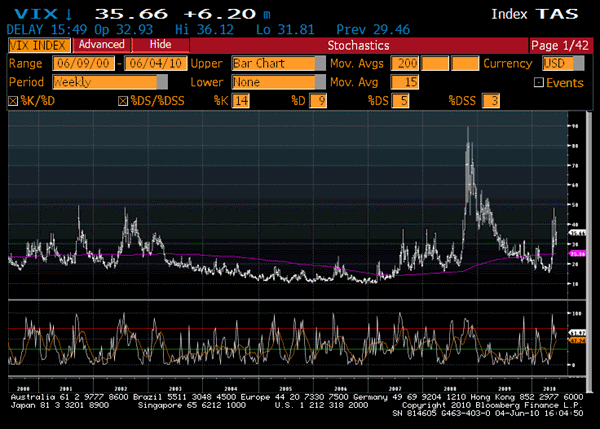
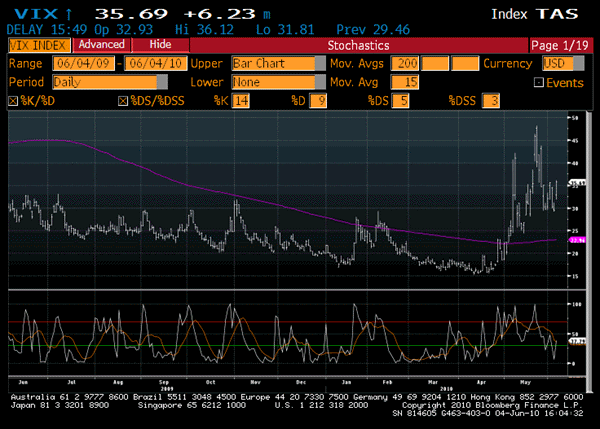
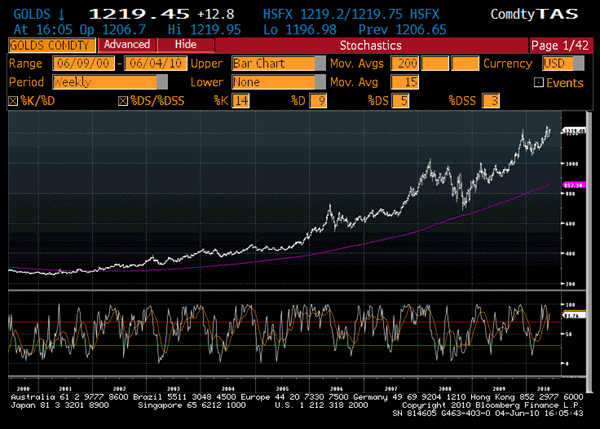
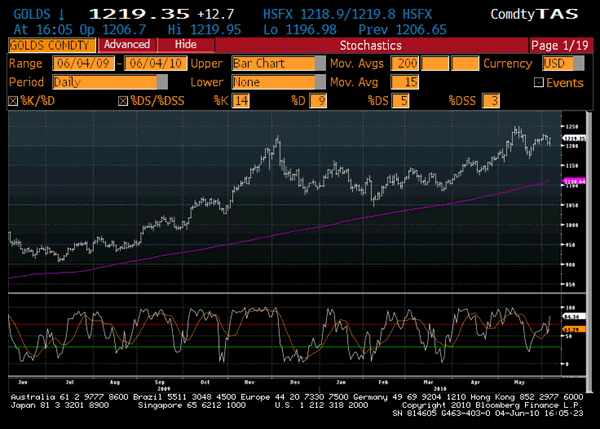
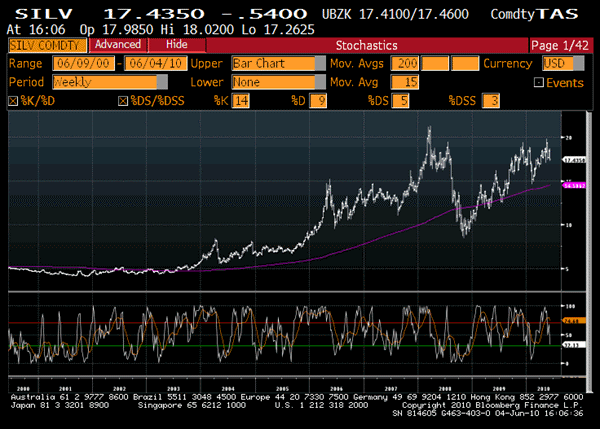
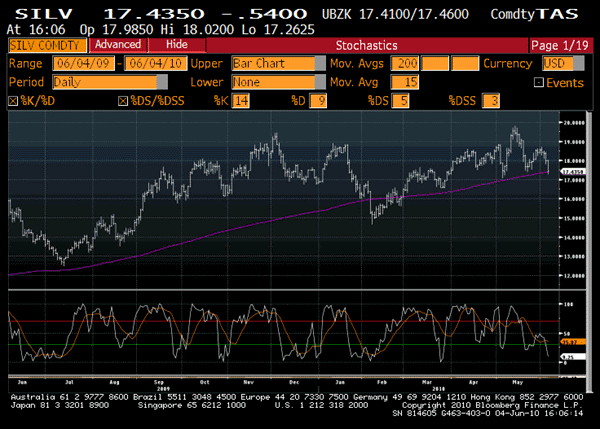
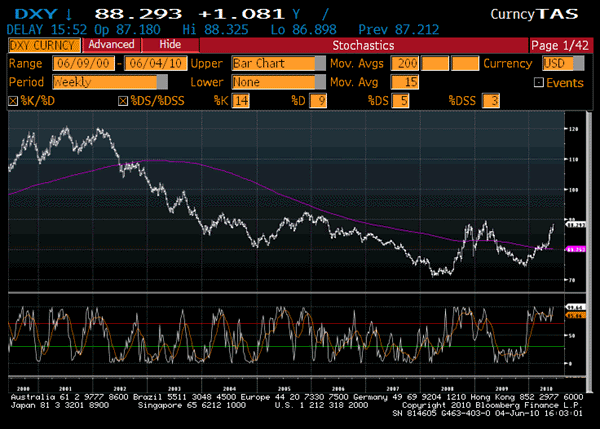
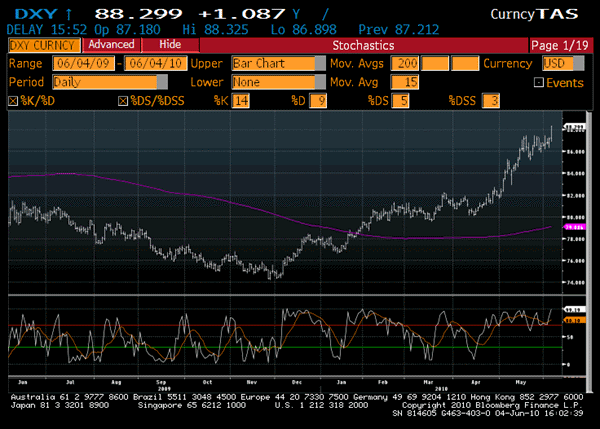
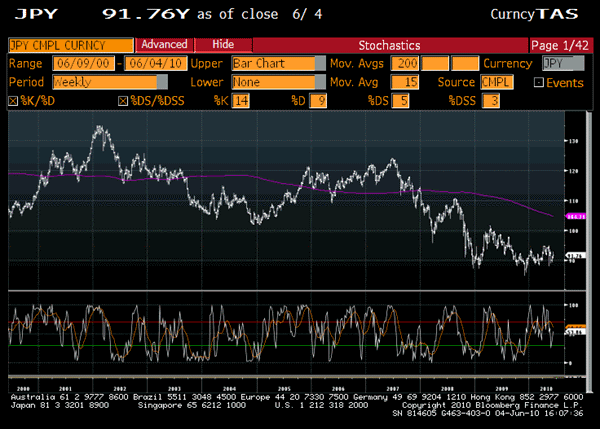
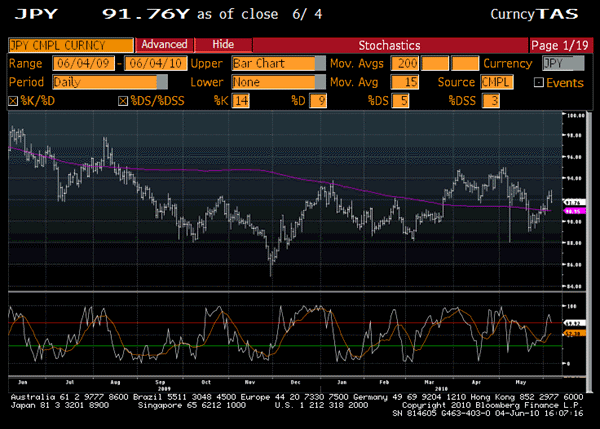
NB: All parties are reminded of the Legal Notice at the bottom of this letter, and the most basic ethics to which it refers. Simply, the transmission of my property is illegal and distasteful. As life's philosophic expression of greed, the likelihood of such pettiness tends to move in lockstep with one's degree of wealth. JAPAN The initial collapse from its November peak took the Nikkei into the mid-9000s, which is consistent with where the Dow is headed (see New York below). The Nikkei's trading at a discount to the Dow is always a warning of an imminent reversion in the Nikkei/Dow ratio, to some integer greater than zero. Since then, the Nikkei has completed a corrective 3-wave structure (up); therefore, the next move is down. This does not auger well for the markets that have been lagging the Japanese index, as, for instance, the Dow would be "prodded" even lower, due to the inversion in the ratio discussed in the previous paragraph. To reiterate past comments, the Nikkei is NOT indicative of where to best invest in Japan and this has been borne out. This is noteworthy for all types of investors, since long short plays of all types are possible due to the funds available on the market. The following is a 10-year weekly chart of the Nikkei. Having forecast the peak at 17,500, the index proceeded to marginally eclipse 18,000, before collapsing almost 50% to where we are today. The recent collapse into the mis-9000s is plainly visible in the 1-year daily chart, as is the 3-wave countertrend move. Also, the bounce toward 10,000, the neckline, right shoulder and 200-week moving average (MA) are plain to see, as is the Nikkei falling shy of these levels (which is typical in a bear market). The 1-year daily chart appears next. This closer look at the index not only illustrates the 200-day MA that hangs overhead, rolled over, it also shows the 9000 support level, which may approximate the completion of this initial move down which began in late April. Given the observations earlier in this section, the question is: how low will the Dow now go? CHINA Discussion and cautioning of this market heading into the apex of its lengthy triangle concluded that there would be a definitive break, either way, most likely down. Shanghai had very limited upside potential anyway. Further, any move up was forecast to reverse as quickly as the rise (according to the Elliott Wave interpretation). Well, that break was down and it has already been most profitable for those involved, especially in premium, due to the extended sideways move that gave everyone who listened an opportunity to react to that premium-bashing pattern. Time had replaced price, as I like to say. Or, time absorbed any buying demand. Perhaps most importantly, the long/short plays have been easy, after having identified and forecast the peaks and troughs since and including 6000. Following is the 10-year weekly and 1-year daily charts, respectively. The preceding charts illustrate the pennant breakdown, resistance at each chart's MA, as well as the rollover of these price charts' moving averages. Except for SKGS readers, many bears have missed the global bear market's most wonderful opportunities for major gains and, with it, yet another cycle of dramatic cyclical swings. DOW JONES* To backtrack, we initially went short at Dow 10,250, +or- 50, and then covered at 400, based on prior reports. The next short was at the perfect peak, following repeated reports calling to exit at 11,000 - 11,200. On the way toward to peak, we went long the VIX slightly under 16. The eventual exit at 40 was the result of a strategic move that would (I correctly believed would result in massive profits anyway), serve as a hedge against not yet being short the equity market. This was easy, because the use of the most conservative time lag assumption (of the VIX to the market), served entry and identification the perfect low. Simply, it was a safe entry for an unusual profit opportunity that also served a major strategic need. So, the positive double-whammies are now the property of the bears…and they will be, beyond the time when many on this planet will be gone. May 26, 2010 letter: "Most instructive of all report titles (if not the report itself) was that of May 6, "UNDER 9000." The report explained why that title was selected. It serves investors well to note why the strategies contemplated in this letter are what they are. So, please review recent missives, and do continue…….." As with 2008, I selected Dow levels that would create a thought of some reasonableness, without which investors tend to consider the commentary regarding lower figures in an academic context, as opposed to one concerned with proper asset allocation and investment selection. Apart from the above, prior reports forecasted levels "under 5000" for the next (this) cycle. Okay, minds open even more after more and more negative and confidence-rattling events take place. So,…. My actual target for this cycle is under 4000, with major intermittent swings, of course. I chose to write 5,000 because it simply conveyed a strong view that Dow would break its 2008-9 lows. With the major economic and financial fundamentals consistently unresolved or worsening, most everyone's imagination could at least grasp and feel the strong possibility of that. From the May 26 2010 report: "My preferred shorts are simple long/short plays which drastically diminish risk, while augmenting profit potential. This is particularly so if the long/shorts are themselves synthetic. "Otherwise - or in addition - I have solely advised long term puts, so as to avoid being whipsawed, as is all too often the case in the futures markets." From the April 14, 2010 interim report: "The Dow's 200-week MA is at 11,133, which, for all intents and purposes is where we closed today (see 10-year weekly Dow chart immediately below). "On shorter term charts, it appears that the Dow's 5th-wave is breaking down into a 5th-wave extension subdivision. Futures traders may try to catch a spear or, as I prefer, simply use premium flush-outs to purchase long term puts (leveraged but defined risk). "You're not a bear if you're not fully short now!" Anyway, the Dow could get hit 1,000 points this week, I believe, or by next, with most of that intra-week damage done over the next 5 days. *See Nikkei section above. VIX Politicians need scapegoats and, as per history, Wall Street will be blamed, as hard as the bear market is long and deep. Lots of folks caught in the crossfire. Some folks seeking an edge, a favour, some angle, something. I remember George Soros testifying before the US congress against derivatives with malarkey that industry professionals could only chuckle at. However, the chuckling will change, as from a butterfly to a caterpillar. Time premiums (implied volatility) are in a massive bull market (VIX), as global derivatives of different sorts disappear one-by-one (and/or with greater and greater restraints). Eventually, the asset class will disappear, under the guise of the most bizarre and false reasons. With that, a tremendous source for/of liquidity will be removed. However, is this view placing the cart before the horse? Matters may play out exactly as I describe here, but the correct interpretation of why that would be happening - despite reality's manifestation - would be the sucking sound of volume out of markets, as wealth is destroyed and disappears. So, to express the order correctly, I believe, the prior paragraphs represent the manifestation of the bigger picture and cause, which I described in the previous paragraph. We are fully short the equity market, basis Dow 11,000 - 11,200. For this reason, we have no position in the VIX, where the net of all trades done to-date reflects extraordinary gains. The following weekly 10-year and daily 1-year VIX charts, respectively, illustrate the precision of prior forecasts, including the trades that yielded the extraordinary profits which were weighed against by only minor losses. That mindset regarding strategy, timing, and investment mix eventually paid today's ongoing sizeable dividends. Through to Dow <9000, the VIX can go to as high as 70, en route to anywhere, at any time. PRECIOUS METALS I maintain that the rally to over $1200, from this year's low, is actually countertrend. The C-wave unorthodox peak (countertrend, despite being a new price high) will be followed by a decline that is caused by equity market losers who need to meet margin calls and pay off the mortgages before doing swan dives out of their Wall Street windows. One sells only what one owns, and gold is where everyone has been heading. 10-year weekly and 1-year daily charts follow. The 10-year chart illustrates how gold has consistently made new-high CORRECTIVE moves (like this one). As I have reported more than once before, silver's 10-year chart reflected the correct wave count, unmasking the fact that gold was often making new highs as part of corrective moves. Simply, this was and is due to superior strength and relenting acquisition, as buyers used weak-kneed sellers to keep accumulating (Eastern sovereigns). The 10-year weekly chart shows a market that is getting ready to accelerate in parabolic fashion, after this C-wave is complete. The following includes the 10-year weekly and 1-year silver charts. My commentary for now is simple and includes a forecast, as well as a hint. While gold's support level has risen by $100 to the $1150 area, or so, silver's support has risen to the $16.50 zone. Remember, the XAU chart resembles/follows silver, rather than gold's. www.gold-eagle.com/editorials_08/klein033110.html DOLLAR, DOLLAR/YEN In the 4th quarter, the low in the Dollar was identified (USD), and it has since rallied to the expected levels, so far (see link). The 2nd and higher level discussed in the linked report seems to be a matter of course and its ongoing COUNTERTREND rally is consistent with the gold analysis above. I suspect that I will be calling a low in gold about the same time that I attempt to identify the peak in the Dollar. The 10-year weekly and 1-year daily charts appear next. The spectacular performance of the Dollar since identifying the low (and adjustment the asset allocation model) is plainly evident. The Dollar/Yen charts that follow thereafter include 10-year weekly and 1-year daily charts. Upon examination, it becomes evident why I called the Yen the best currency in the world for capital appreciation. Against the backdrop of Dollar strength this year, the Yen has been the powerful safe haven, while Europe has shook. Just as I maintained a sizeable strategic position in the Yen while the Swiss Franc was the strongest quality fiat currency, I have maintained a sizeable and strategic position in the Yen. Since 2002, no asset allocation model has been so consistently accurate, with the fewest adjustments, focusing always on risk-adjusted performance. These are important, as 50% of all liquid wealth is at stake. My asset allocation model is unchanged: 50% gold, 50% split between the Swiss Franc, Yen and US Dollar.
Sid Klein Global Strategy
1001 BOUL. DE MAISONNEUVE O., BUREAU 950, MONTREAL, CANADA H3A 3C8
TEL: (514) 939-2221 FAX: (309) 417-0942
e-mail: sidklein@sidklein.com
www.sidklein.com
UNDER 4000?
(And the Death of Derivatives)
![]()

![]() June 6, 2010
June 6, 2010
