
The Oil Price, Where is the Next Buying Opportunity? Commodities / Crude Oil Jul
posted on
Jul 13, 2010 03:32PM

Edit this title from the Fast Facts Section

Commodities / Crude Oil Jul 13, 2010 - 01:38 PM
By: Keith_Schaefer

 Brian Hoffman writes: About six months ago I wrote that the technical outlook for oil prices indicated oil prices may drop in the event of a downward breakout from the rising wedge that had formed in the price chart for light crude oil, or that prices should find support at US$85 per barrel if an upward breakout were to occur from that price level. A downward breakout occurred and we are now looking at the possibility of even lower oil prices over the next few months.
First, a refresher on wedge chart formations, which are continuation patterns such that a rising wedge is a temporary pause in a falling price trend, and a falling wedge is a temporary pause in a rising price trend. During the formation of a rising wedge the selling pressure on prices has started to overwhelm the buying pressure resulting in the slope of the top trend line (resistance) tilting towards the bottom trend line (support). If the support provided by the bottom trend line fails to hold prices and a downward breakout occurs, a sharp and significant price drop may follow.
Oil prices are currently trying to find support at US$70, and the next strong support level is at US$60, which would result in a retracement of about 50 per cent of the move from the US$32 low of early 2009 to the recent high of US$88 high. If oil prices were to drop as low as US$60 and find support at that level the stage could be set for the next rally in oil prices. On the upside, oil prices need to break through US$90 and find support at that level in order to reverse the current bearish trend.
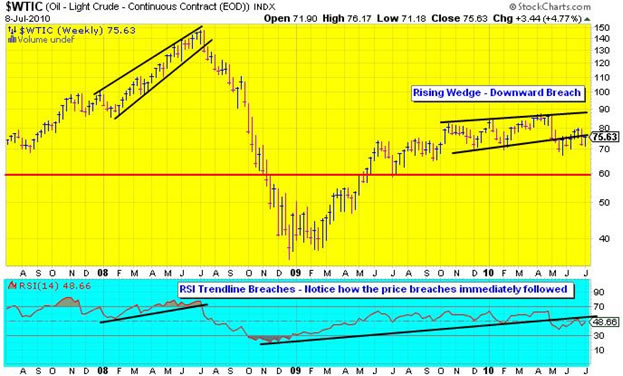
Another bearish indicator for oil is the recent breach in the uptrend in the Relative Strength Index (RSI). RSI is a momentum indicator, or oscillator, that measures the relative strength of the price of a security or, in this case, a commodity against itself. A buy signal is triggered when an upward breakout in the RSI is confirmed by an upward breakout in price. Conversely, a sell signal is triggered when a downward breakout in the RSI is confirmed by a downward breakout in price. A sell signal was triggered in May (see bottom panel in the chart above). Notice the price action for oil the last time the RSI uptrend line was breached in June 2008, which definitely confirmed the sell signal at that time.
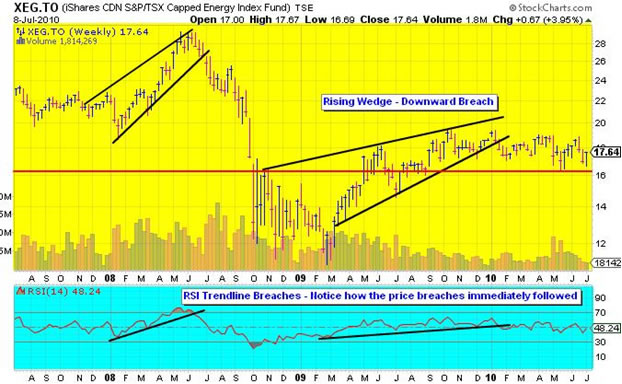
Oil prices have several support levels below US$60, but a breach of the US$60 support level could result in prices dropping a lot lower and potentially retesting the US$32 low from late 2008. Although such a scenario is extreme, it is within the realm of possibilities given the technical weakness in broader market indexes, including the energy sector (see below), as well as the ongoing global financial deleveraging process and the austerity measures that the future holds.
The price charts for the United States Oil Fund, LP (USO-NYSE, US$34.23), an ETF that tracks the performance of light crude oil prices, and the iShares CDN S&P/TSX Capped Energy Index Fund (XEG-TSX, $17.64), an ETF that tracks large-cap Canadian oil and gas companies, are shown below. Notice the similarities in those price charts to the chart for light crude oil prices above in terms of downward breakouts from rising wedges and the sell signals triggered from breaches of the RSI uptrend lines along with the downward price breakout confirmations (the horizontal lines in the charts below indicate near-term support levels). The noticeable differences with the XEG ETF’s price action are that the downward breakout from its rising wedge occurred a lot sooner and the price failed to exceed the January price high during the seasonally strong February to May period. With oil prices performing better than the share prices of oil companies that is a bearish indicator for the XEG ETF.
Conclusion: Oil prices may drop to US$60 over the next few months if they fail to find support at US$70, which will impact oil-related investments. Watch support levels on positions of oil sector investments as the share prices of some oil companies have already breached their support levels. If oil prices drop to US$60 then wait for support to firmly establish at that level before taking positions in oil-related investments. This scenario may take until October to play out, which may present an ideal entry point in November.