the dollar trend
posted on
Oct 12, 2010 04:08PM

Edit this title from the Fast Facts Section

|
The Market Oracle Newsletter |
|||||||||
|
Inflation Mega-Trend Ebook Direct Download Link (PDF 3.2m/b)
Dear Reader
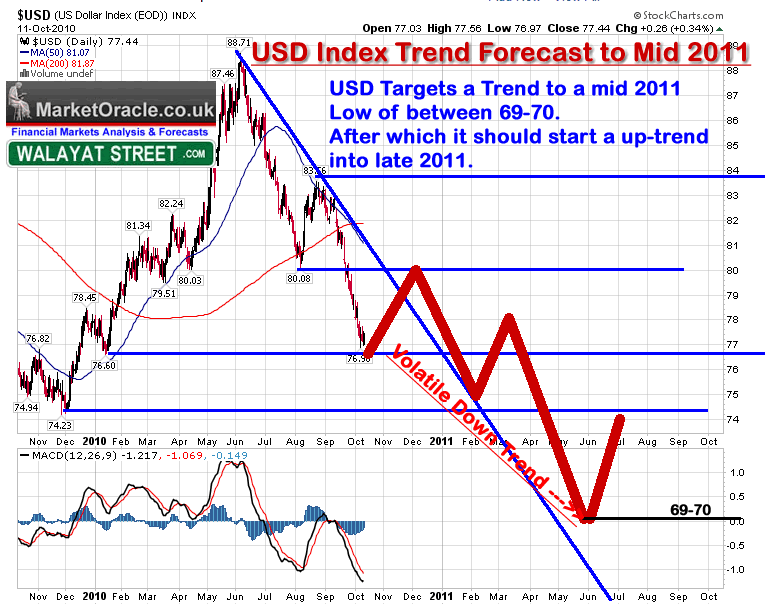
Following the USD Index peak at 89 in early June 2010, the Dollar has been on a near relentlessly slide to the recent low of 76.90 which represents a 14% fall in just 4 months. The fall in the Dollar has again brought out the perma Dollar collapse proponents who have periodically come out to reiterate that the U.S. Dollar as measured by the USD index is destined to crash and burn which is set against the perma deflationists who continuously propose that DEFLATION will result in the Dollar rallying to new highs as a consequence of debt deleveraging, which again was most prevalent just as the U.S. Dollar peaked. Therefore this in-depth analysis will seek to conclude towards a probable trend forecast for the USD index into Mid 2011 (9 months forward).
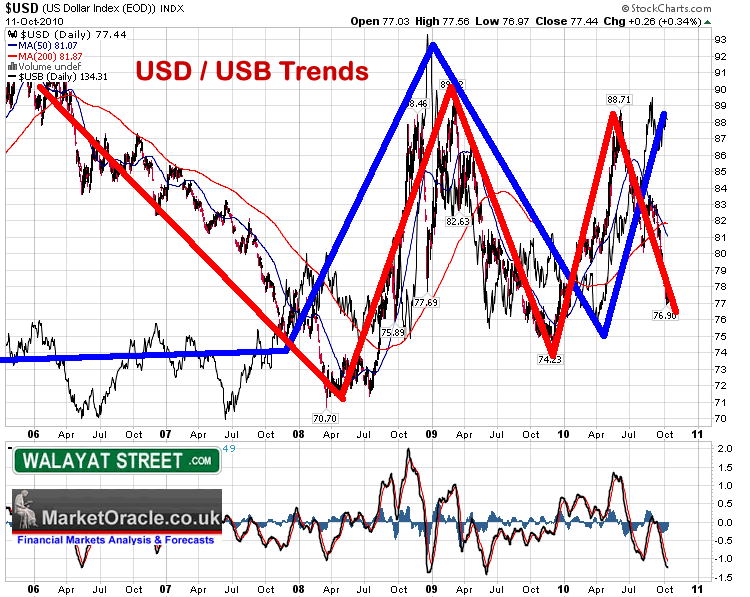
In the face of the relentless dollar collapse mantra due to hyperinflation or the Dollar Soaring due to debt deleveraging deflation mantra for the past 3 years, the actual dollar trend is illustrated by the below graph shows that in actual fact the USD is UNCHANGED from where it was some 3 years ago! Which illustrates that much of that which you will read in the mainstream press and BlogosFear has its basis in propaganda rather than analysis focused on the monetization of probable trends as both perma crash and boom crowds are most vocal just as the USD index turns in the opposite direction, which means that both perma crowds of propagandists would have LOST money had they actually acted on their respective mantra's.
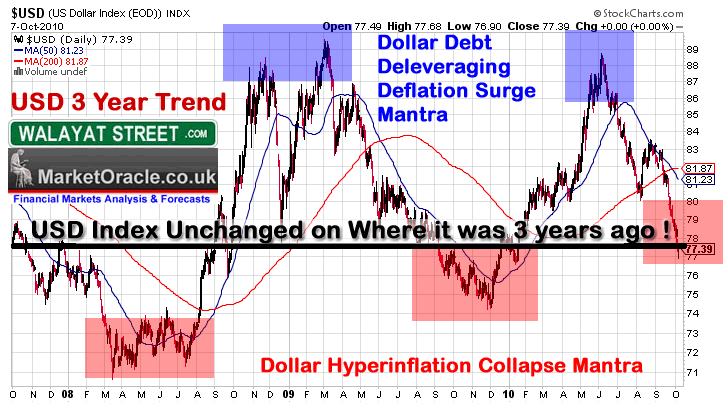
So be under no illusion when you start reading or hearing volumes of commentary that states that the US Dollar is going to collapse or crash during the next x days then you have to consider the above historic 3 year record that implies that all they are doing is pumping out propaganda regardless of the actual subsequent trend.
Before I get to the meat of the analysis and forecast for where the USD could trend to over the next 9 months, here is a re-cap of my USD analysis over the past 2-3 years.
May 2010 saw the Dollar soar as a consequence of the Euro-zone sovereign debt crisis to a peak of 89 by early June, with the uptrend subsequently evaporating as the Eurozone sovereign debt crisis failed to trigger a collapse of the Euro to presently take the USD to all the way back to where it started the year.
 I recently completed an in-depth analysis and concluding forecast trend for the British Pound Against the U.S. Dollar (GBP) (04 Oct 2010 - British Pound Sterling GBP Currency Trend Forecast into Mid 2011), which touched upon many aspects that impact on the USD trend that I won't repeat in this article such as :
Therefore, if the reader requires a fuller understanding of the innards of my on going currency markets analysis and subsequent forecasts, then it may be worth reading the above in-depth analysis, the conclusion for which is inserted below that helps build towards a forecast for the USD Index.
BRITISH POUND CONCLUSION
The people of Britain should count themselves lucky to have a government that gives all of the signs that it in tends on getting a grip of the budget deficit, though contrary to the politicians statements the government will NOT be able to prevent total debt from increasing by 50% over the next 5 years, which suggests that most of the politicians do not understand Britain's debt situation as they confuse deficit reduction with debt reduction. Nevertheless the positive outcome is for a lower pace of decline for sterling than the dollar (the U.S. is busy printing money to finance a military it cannot afford) which therefore implies a higher UK GBP rate as long as the proposed cuts and deficit reduction materialises, which according to my own analysis suggests that the government should be able to do so for at least the next 2 years, so in currency trends terms this is bullish for sterling for at least the next 1-2 years against the U.S. Dollar, which is set against the US authorities showing NO signs of restraint in terms of getting a grip of the deficit instead the opposite is true.
In terms of the GBP trend, the UK appears to have entered into the goldilocks zone (comparatively speaking) i.e. deficit reduction without triggering a double dip recession, a trend that looks set to continue for at least a year. The big question mark is how will the US economy perform relatively speaking, all the signs are for the US economy to continue to underperform the UK for the next 12 months which confirms a bullish GBP trend.
GBP Final Forecast Conclusion
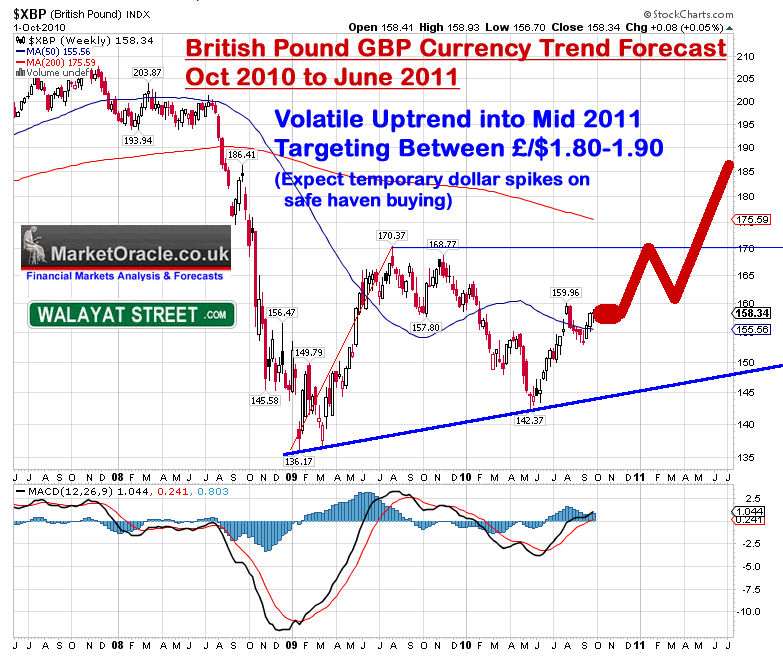
The British Pound is in a multi-year bull market against the U.S. Dollar, I expect the current phase of this bull market to see GBP trend higher into mid 2011 targeting a rate of between £/$ 1.80 and £/$1.90 as the below forecast trend graph illustrates (current £/$ 1.58), though I would not be surprised if GBP trades above £/$1.90. I also expect sterling to strengthen against the Euro that targets a trend high E/£ 1.30 (current E/£1.15). However the forex markets will be just as volatile as they have been during the past 2 years as future sovereign debt and banking sector crisis will temporarily result in a surge of safe haven dollar buying, which will present future opportunities to short the dollar.
GBP Forecast Implications for USD Index
The above forecast for GBP to rally by 17% rally by mid 2011 when applied to the USD rate suggests a likewise 17% downtrend to target approx USD 65, which is clearly very bearish that implies a new all time low for the USD Index, though GBP just comprises 12% of the USD Index so it does not mean that it will actually get there, hence the need for this article.
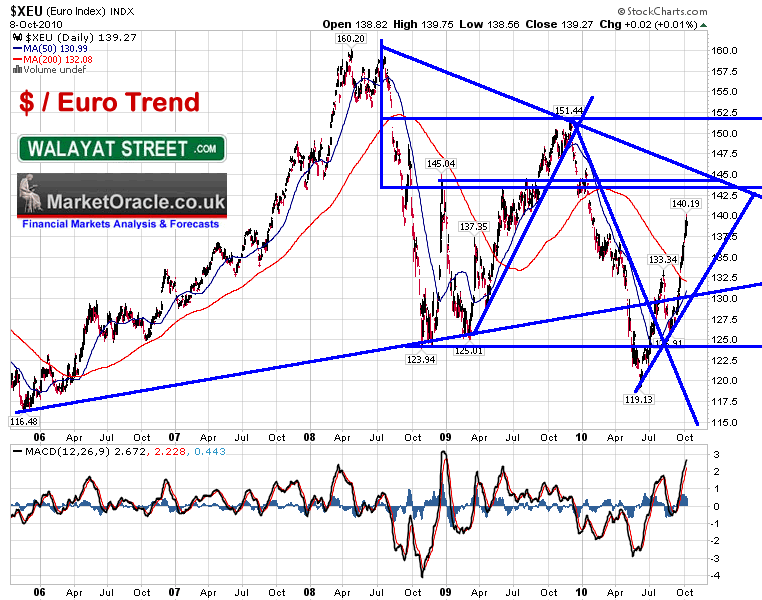
The Euro comprises 60% of the USD index which therefore represents the prime determinant for the USD index trend. The current rate is 139, a quick analysis of the price chart suggests the Euro is targeting 145. A stronger breakout targets 150-152. The current trend is overbought therefore the Euro is unlikely to reach the target without a serious correction, the last correction was some 9 dollars, which suggests that a correction from the 140 peak could retrace to 131, which coincides with the support level trendline.
Possible Implications for the USD Index
The Euro target of 145 implies a 3.5% drop on the USD index to 74 which coincides with the last major USD low. A further out target of 150 implies USD 71 which coincides with the all time USD low. This first suggests USD 74, then USD 71 further out. The only question mark is in the timing of the trends as immediate future implies that the Euro should correct towards 131 which coincides with USD 82.
So clearly the following stands out:
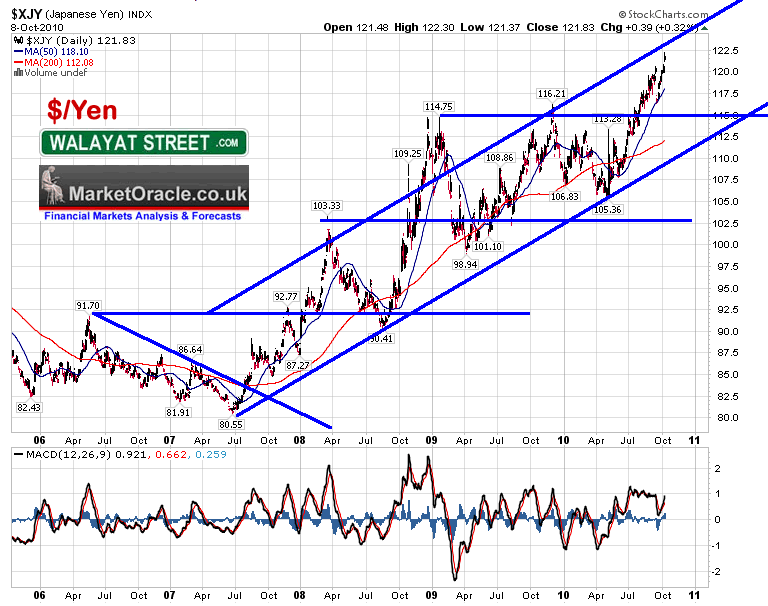
Ouch! - If there is a currency war taking place then Japan is definitely losing the war! The Japanese Yen comprises approx 14% of the USD Index, so roughly ranks along side the British Pound in terms of trend impact. The Yen has clearly been in a strong uptrend against the Dollar that is nudging towards the upper end of a multi-year channel that suggests upside is limited to not far above the current level of 122, perhaps just 123. This suggests that the Yen should start a correction in the near future towards first 116, and then secondly 110, which represents a 5% / 10% correction against the dollar.
Implications for the USD
A 5% - 10% correction against the dollar, translates into a USD move to 81 and then 85. Which therefore is supportive of the dollar at least in terms of dollar yen, as I don't see it happening in terms of the USD index. However an imminent Yen correction implies that the dollar could experience a lift in the near future towards 80 before year end, beyond that it is not clear as the Yen could base at 116 before setting itself up for a new all time high against the dollar i.e break above 123 i.e. suggesting dollar strength into End 2010 and then weakness into mid 2011, which roughly matches Euro expectations, though out of sync with GBP.
The mainstream press has belatedly woken up to the fact that all exporting countries are vying to devalue their currencies against the primary destination for all junk goods, the United States. Without repeating what I wrote at length in last weeks analysis (04 Oct 2010 - British Pound Sterling GBP Currency Trend Forecast into Mid 2011 ), clearly the above pairs show that the currency war is definitely not being won by Japan, though the Germans appear to be prospering from the bankrupting PIGS to some extent, so who is actually winning the 'currency war' ?
Dollar / Yuan
Saving the best till last as China is the master currency manipulator as evidenced by the flat lining graph over the past 2.5 years. Which illustrates the degree to which China manipulates its exchange rate against the U.S. Dollar. The Dollar / Yuan trend is highly political where the Chinese only respond to political pressure in terms of letting the Yuan appreciate.
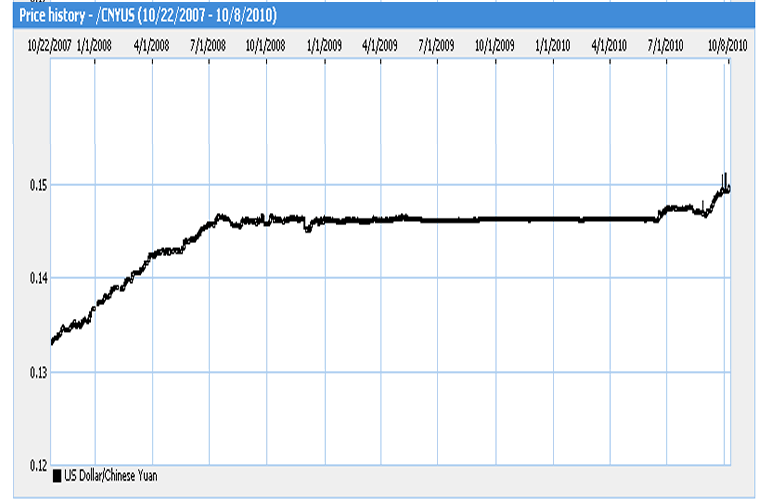
Pressure is building in the U.S. for action on the Yuan / Dollar peg which if it follows the last major revaluation suggests that the recent rally may just mark the starting point for a major but gradual revaluation of the exchange rate over the next 2 years to a level that will be followed by several more years of a highly managed fixed rate to again eventually result in political pressure on China to revalue once more.
Implications for the USD
The Yuan is not part of the USD Index which on face value suggests that it should not have a significant impact. However to push the Yuan lower against the dollar the Chinese will be selling Dollars (or buy less dollars) for Yuan thus increasing the supply of dollars and thus pushing the dollar lower against all currencies which I anticipate will be at least a year long trend of extra downward pressure on the US Dollar. The implications are for the USD to trend lower over the coming year to a NEW USD low much as transpired during the last revaluation.
China Winning the Currency War
All of the above mentioned countries consistently run huge trade surpluses against the US Dollar, which should in a free floating (falling) currency market result in a greater rate of descent for the US Dollar as a consequence of the trade imbalances, but especially China is refusing to allow these imbalances to correct themselves, instead China sees primarily the US Consumers (Mall Zombies) as a prime driver for China's economic growth even if it means they ultimately suffer huge losses on their $2.5 trillion of reserves, which given the big picture is a small price to pay for Chinese GDP doubling approximately every 8 years to now stand at $5 trillion annually. Therefore China has been winning the currency war for a decade and is now expanding its operations to force competitors such as Japan out of business by FORCING the Japanese Yen higher, which is why Japan and other western nations are preparing to dump huge amounts of their currencies on the market in an attempt to counter Chinese actions. China's strategy is for a gradual revaluation to both sooth Washington and allow its exporters to adjust to the gradual currency appreciation which means there won't be much impact on the trade deficit, unless China starts to import U.S. goods and services.
Meanwhile American workers are deluding themselves into believing that they deserve to be paid ten times Chinese and other asian workers for performing similar servicing or manufacturing jobs. The bottom line is that the U.S. is highly uncompetitive in terms of worker productivity where even a currency crash of 50% would not make much difference. In my opinion there is absolutely nothing that the US can do but to go through the painful process of making their workers more productive after having been on a debt binge for the past 30years that financed living standards. The government / Feds only answer is to print money, they do not have any other answer as the politicians cannot engage in policies of severe austerity, far greater than that which Greece is suffering that will effectively have the voters throw them out of office, therefore the money printing debt monetization trend of the giant debt and liabilities mountain that some say stands at $200 trillion, which is far beyond the official tally of $13 trillion which ridiculously under estimates the true level of US debt. For instance the nationalisation of Fannie and Freddie alone added $10 trillion of liabilities, effectively doubling the US national debt at the time. The debt monetization trend will continue for the next decade if not longer as INFLATION (take note delusional deflationists) will be the prime mechanism that eats away at the debt mountain and purchasing power of US wages so that they converge in terms of real competitiveness with the rest of the world.
The Cold War Trade Deficit Policy
The manifestation for this lack of competitiveness is the trade deficit. It is NOT the fault of the Chinese that the trade deficit exists, it is the fault of the US consumers who BUY CHINESE and JAPANESE JUNK! This is as consequence of the policy of successive US Governments dating back to the midst's of the cold war era when the United States used the Dollar as a global reserve currency weapon against the Soviet Union to exert control over other nations through currency and trade and to achieve this meant that the U.S. was required to operate a trade deficit so as to advance the U.S. centric global financial system that succeeded in squeezing the financial life out of the Soviet Union as its currency collapsed. The only problem is that the U.S. and the rest of the world had become so drunk on the U.S. perpetual trade deficit policy that instead of correcting this following the collapse of the Soviet Union i.e. by reducing the dollars reserve currency role, it just continued as the U.S. imported Deflation in consumer goods and services from Asia in exchange for mountains of U.S. Dollars that reinforced the dollars hold over the global financial system but only upto the point where the U.S. were able to maintain the value of the U.S. Dollar.
Today we have near zero US interest rates whilst at the same time the trade deficit counter parties are siting on ever expanding mountains of dollars, which MUST EQUAL a falling dollar rate UNTIL interest rates RISE to reach an equilibrium point against the surging dollar holdings. But as mentioned earlier the U.S. is drunk on the trade deficit policy and that of foreigners financing the US budget deficit which has the effect of gradually diminishing the reserve currency status of the U.S. Dollar which has the tendency of accelerating the trend for a falling U.S. Dollar. Now I am not talking about a collapse, what I mean is the overall multi-year trend for ever lower lows and ever lower highs.
What Does this mean for the Dollar ?
The U.S. is pumping out deficits without end of $1.5 trillion per annum, whilst at the same time lecturing the world on capitalism when in actual fact it through its actions has become the worlds biggest socialist state that does what all socialist countries do best which is to print money to finance federal and state deficits. The continuous flood of dollars is set against the exporters all fighting to devalue to hold onto the US export markets. This also suggests a slower relative rate of descent for the Dollar than should take place, if not reinforcing the trading range of USD 90-70, because as the dollar slides towards the multi-year lows so will the intensity of foreign central bank actions to force their respective currencies lower intensify. Ultimately the dollar's multi-year trading ranges are destined to take steps lower all the way to the ultimate panic stage when hyperinflation kicks in which it eventually will do as the fundamentals of the ever expanding total debt as a % of GDP suggests ever higher inflation all the way towards ultimate debt default through ever higher inflation.
Don't be lulled into a false sense of security by the ongoing false calm before the inevitable debt default storm via high inflation! After all that's what Icelanders thought before their economy and currency went POOF, that's what the Greeks thought before their interest rates suddenly more than tripled with the Germans stepping into bail them out (temporarily).
Hyperinflation ?
Given the ever expanding debt load it appears hyperinflation will be the ultimate destination. When ? Don't know, Hyperinflationary panics are akin to stock market crashes (especially in today's technology enhanced hyper-speed world), they can only be recognised at best a few days before the event though more likely a few hours before there is a panic run on the U.S. banking system as depositors panic out of dollars and into anything else, we are talking trillions of dollars dumped in perhaps a couple of hours sending the dollar into a nose bleed dive that no central bank will be able to prevent, that's how hyperinflation will start.
Again don't take this as a forecast for hyperinflation because it can't be forecast, it is a fiat currency panic event. Luckily inflation protection strategies can also protect against aspects of eventual hyperinflation. Note - I do not see any signs that suggest a Dollar hyperinflation event is imminent or likely during the next 12 months.
My in-depth analysis during August warned of the U.S. Treasury bond bubble that was primed to burst (26 Aug 2010 - Deflation Delusion Continues as Economies Trend Towards High Inflation ) since which time US bonds after a wobble into September have maintained their value as the interest rate risks has been transferred over to the Dollar. Therefore bond investors have in actual fact lost 8% of the value of their bonds since the August Bond market peak.
The normal expected tendency is for a falling dollar to be accompanied by lower bond prices, and a rising dollar to be accompanied by higher bond prices. This has been more or less the case until the most recent price action which has seen a disconnect between the Bond market and the U.S. Dollar. This illustrates the degree to which the US bond market is being manipulated through a wide variety of measures to monetize government debts by means of the banking system by basically allowing banks to generate huge profits at little risk as they are able to borrow form the Fed at near zero rates and then go and buy government bonds on leverage of X20 upwards at typically 3% and therefore banking profits of 60% so what do the banks care if they lose 8% in terms of the dollar value, or a another 4% to 8% on real inflation measures (shadowstats) when they are banking 60%+ profits courteously of the Fed.
However at some point there will be a snap back into alignment between US Bonds and the Dollar, which means that the U.S. Treasury Bond market remains a bubble primed to go pop!
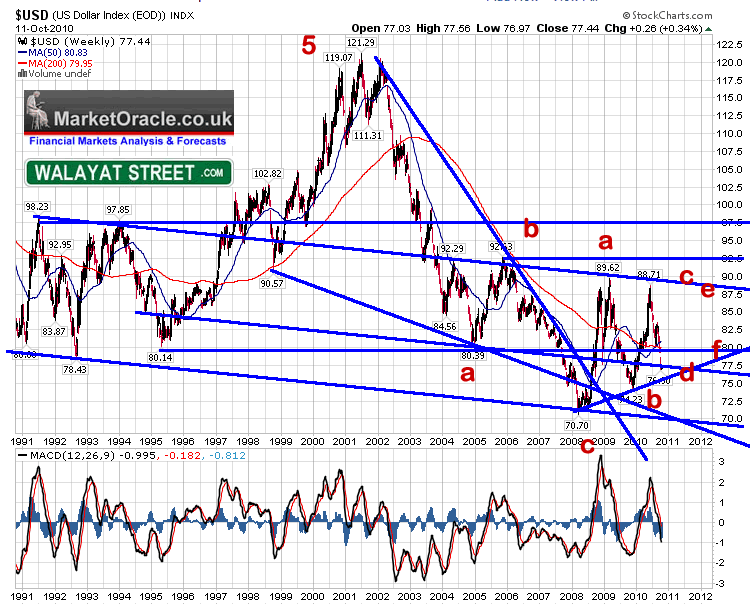
ELLIOTT WAVE THEORY - The Elliott wave pattern suggests that the USD index is in a corrective triangle that implies the downside is limited to about 75, and that it could target a trend to as high as 88. However the triangle is corrective which implies that it should ultimately resolve towards a break lower, though possibly not for several years.
TREND ANALYSIS - USD is targeting the uptrend line at about 75, and trending in a wider down channel that targets a low of 70 by mid 2011 and an upper channel line of 88. Given the lower high, probability on balance favours a break of 75 to target 70. With another more severe down trendline also intersecting by mid 2011, therefore implying mid 2011 as a possible significant reversal point.
SUPPORT / RESISTANCE - There is heavy support in the zone 71 to 74 which suggests any downtrend into this zone is going to be rough, very volatile i.e. unlike the swift downtrend from the 88.71 high.
PRICE TARGETS - The USD Targets 71 to the downside and 80 to the upside.
MACD - The MACD is confirming a pattern for a corrective triangle, which suggests that the USD should make a higher low i.e. hold the uptrend line to thus target the upper end of the down trend channel.
SEASONAL TREND - The recent trend is inline with the seasonal tendency for the USD to weaken between June and October, a continuation of which would suggest the dollar to now be near a bottom and trend higher into mid 2011.
USD MEDIUM-TERM TREND ANALYSIS
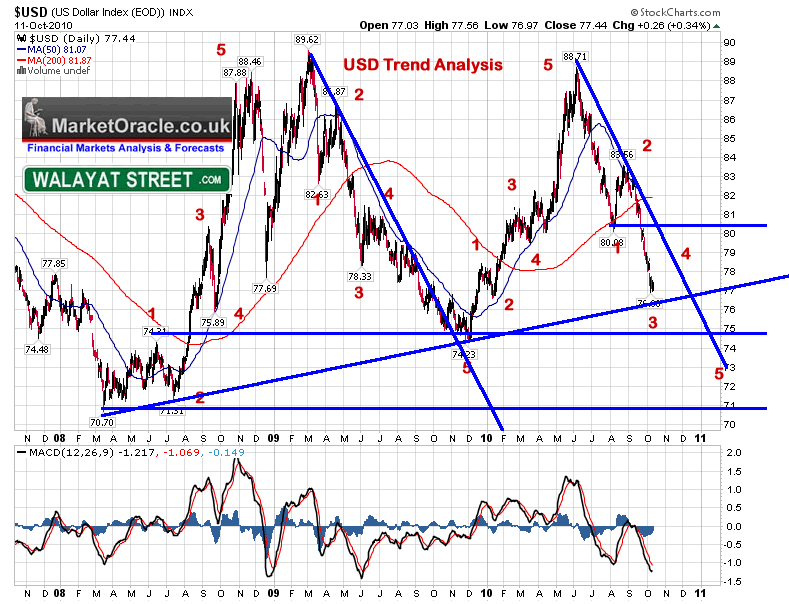
ELLIOTT WAVE THEORY - The Elliott wave pattern clearly manifests in 5 wave patterns in both directions, which on face value implies that the USD should be near a bottom for a rally towards 80, before targeting a break of below 74 towards a target of 72.
TREND ANALYSIS - The USD uptrend line support is even more prominent on the short-term chart at USD 76.30, which implies that a USD low is imminent to target a trend higher into early December. The downtrend line suggests that the USD will meet strong resistance at 79.
SUPPORT / RESISTANCE - There is heavy support in the zone 74 to 75, and resistance at just above 80.
PRICE TARGETS - The USD Targets 74 then 71 to the downside and 80 to the upside.
MACD - The daily MACD is heavily oversold which implies a reversal is imminent. However the lower low implies it that it should not be a final low i.e. the MACD implies that the current USD low should break on the next swing lower.
The U.S. Dollar is in a downward spiral, as the further it falls the further it will fall in the future as the weaker the Dollar becomes in terms of its status as the global reserve currency as other currencies start to be seen as possible alternatives. BUT this long-term downtrend does not suggests a crash or collapse is imminent as the perma dollar collapse proponents continuous mantra suggests. In fact whenever you see a surge in such commentary than one can conclude that the U.S. Dollar is either at or near a significant bottom which could result in a substantial multi-month USD index rally, which appears likely in the near future.
The key targeting levels for the USD are the all time low of 70.70 and the preceding high of 88.70. Actual USD price action is subject to banking sector credit crisis and sovereign debt crisis events as we saw during May 2010 that will result in temporary dollar spikes. Therefore volatility will be just as high as has been observed over the past 3 years. As is usually the case, these crisis events cannot be forecast, but that the USD trend should revert to the fundamentals based technical trend as the crisis event subsides which is as concluded to below.
USD Index Forecast Final Conclusion
The USD index is targeting a trend to a new all time low in the region of USD 69-70 by mid 2011, that will be followed by a strong rally that could see the Dollar retrace all of the decline back towards USD 80. The problem is with the timing of these trends as volatility will be high. It's a tough exercise but I conclude in the USD taking some time to base following the mid 2011 low before the subsequent bounce to 80 takes place. Therefore the forecast trend is USD 69-70 by mid 2011 followed by a bounce to 80 by October 2011. The immediate future is suggestive of an imminent bounce towards 80 by early December before the final swing lower to a new all time low takes place as illustrated by the below forecast trend graph.
Risks to the Forecast
The risks to the forecast are that the doom and gloom perma dollar collapse proponents are right (this time) and the USD is going to burn a hole through the floor, or that the earlier elliot wave analysis is more accurate than I give credence to, which implies that the USD is in a converging triangle that suggests that the USD will rise towards 88 from the current low, which I would actually say is more probable than the Dollar crash / collapse alternative.
Stocks Stealth Bull Market Closes Back Above Dow 11,000
The Dow on Friday closed above 11,000 at 11,006 for the first time since just before the May 6th Flash Crash. Off course no one saw the flash crash coming, but subsequently many have eagerly anticipated its re-occurrence all the way back to above Dow 11k.
The whole summer has seen the perma-bears and the BlogosFear busy confusing what amounts to propaganda with analysis as they took a pre-existing WRONG conclusion and then search for data that supports it, much as the perma deflationists have picked at the odd bits of deflation indications to back up a model that does not exist in reality (26 Aug 2010 - Deflation Delusion Continues as Economies Trend Towards High Inflation).
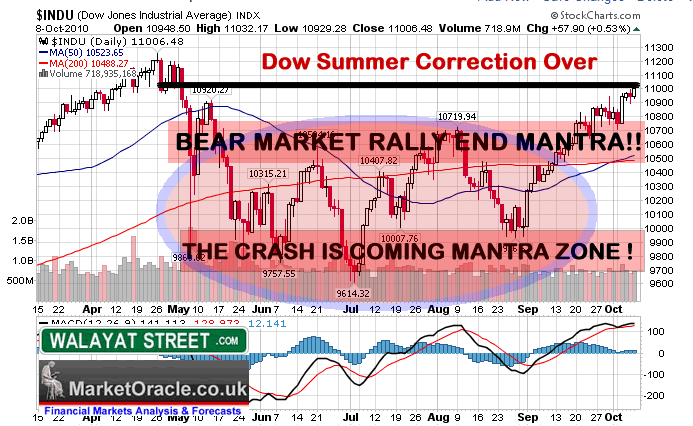
During the summer months the expectations of another always imminent flash crash morphed into June and July's bearish Head and Shoulders price pattern, that saw its right shoulder twist and turn as another higher shoulder always materialised hunchback of Notre Dam style all the way into August, which turned into the dreaded always imminent Hindenberg Crash Omen month, which was soon replaced during September by repetitive warnings that that September could be the worst month of the year on the basis of statistics and perma views when it turned out to be the BEST September for 70 years !
Mapping Out the Trend for 2010
The Dow during September continued the trend in line with my last quick analysis of (29 Aug 2010 - UK Economy Booms Whilst U.S. Stutters, Stocks Fail to Follow Crash Script ) that concluded in an anticipated break of the downtrend channel that the Dow had been in at the time, with the primary buy trigger at 10,200 to target the top of its trading range of 10,700 with probability favouring a break higher. With further interim analysis during September confirming this view (05 Sep 2010 - Inflation Mega-Trend Long-term Growth Spiral Continues to Drive Stock Market Trend )
Bottom Line - Nothing new to report short-term the Dow remains in a corrective trading range of approx 10,700 to 10,000. Everybody tells you that September is usually one of the worst months for stocks. I say its in a range with probability favouring a break higher.
The Dow had remained in its corrective trading range that has continued to work off the preceding 13 months bull run, with my last in depth analysis (16th May 2010 - Stocks Bull Market Hits Eurozone Debt Crisis Brick Wall, Forecast Into July 2010 ) concluding that the corrective sideways trend could extend all the way into early October, with trading range expectations for a low at 9,800 to be followed by the Dow targeting a break of 10,7000 with the subsequent price action pretty much having followed this script throughout the summer months. The more time the stock market spent within its corrective trading range the more powerful would be the eventual breakout.
My original expectations remain for the Dow to target 12,000 to 12,500 by year end as illustrated in the January Inflation Mega-Trend Ebook (FREE DOWNLOAD).
Stocks Stealth Bull Market Summer Correction is Over
We are now well into October, and the perma bears continue as to why an end to the so called bear market rally is ALWAYS IMMINENT, despite that fact that the perma mindset has been WRONG SINCE MARCH 2009, who now explain the most recent rally action (after the event) as a consequence of imminent QE2 as the mechanism to blame for being wrong, the reasons for which I touched upon in a recent article (10 Sep 2010 - The Real Reason Why 90% of Traders Lose).
The bottom line remains as I voiced right at the bottom of the stocks bear market and the birth of the stocks stealth bull market in March 2009 - (15 Mar 2009 - Stealth Bull Market Follows Stocks Bear Market Bottom at Dow 6,470). That the stealth stocks bull market will be driven by the twin forces of either economic trends surprising to the upside or Quantitative Easing aka money printing to drive asset prices higher as once Q.E. STARTS IT CANNOT BE STOPPED whilst large budget deficits persist that require debt monetization regardless of what the central bankers publically state, something that I have iterated virtually every month for the past 2 years, including at length in the January 2010 Inflation Mega-Trend Ebook, because the whole banking system has been geared towards ONE OBJECTIVE and that is towards the monetization of government debt either via outright money printing or the fractional reserve banking system that entices the banks with huge profits to buy government bonds as I covered at length in the recent article (19 Sep 2010 - UK Government Stealth Debt Default Continues at Minimum Rate of 3% per Year).
Stocks are in a MULTI-YEAR BULL MARKET that is being driven higher either by corporate earnings surprises to the upside OR MONEY PRINTING in the face of weak main street economic activity. It does not matter which is prevalent at a particular point in time as the markets SPIRAL HIGHER in reaction to both waves of INFLATIONARY buying pressure, something that the dark pools of capital recognised right at the birth of the stocks stealth bull market and have since been eager to bid the stock market higher whilst MOST have FAILED to participate on the rally to date (if not been engaged in betting against) and will continue to do so all the way to new bull market highs which is why it remains STOCKS STEALTH BULL MARKET.
The same INFLATIONARY forces are driving up all assets such as commodities, whilst at the same time holding up other assets such as housing that should be in free fall as the bubble baton is passed from one asset class to another.
In our fiat currency, big government deficit spending, debt accumulating world, governments CANNOT ALLOW FOR DEFLATION, not only that but inflation can literally always be created at the press of a button, therefore as asset prices are leveraged to consumer prices that is where wealth protection strategies should be focused towards.
Where will the stock market go next ?
The summer correction that saw the Dow base at between 10,000 and 9,800 is over, which means that the Dow trend targets 12,000 to 12,500 by year end, which whilst it won't get there in a straight line, the stock market has done nothing to negate this scenario for the whole of 2010. On completion of the USD forecast, my focus is now for an in depth analysis and chart trend forecast for the Dow to more precisely cover the trend into the end of 2010. To get the analysis in your email in box on completion ensure you are subscribed to my ALWAYS FREE NEWSLETTER.
Comments and Source : http://www.marketoracle.co.uk/Article23427.html
By Nadeem Walayat
Copyright © 2005-10 Marketoracle.co.uk (Market Oracle Ltd). All rights reserved.
 Nadeem Walayat has over 24 years experience of trading derivatives, portfolio management and analysing the financial markets, including one of few who both anticipated and Beat the 1987 Crash. Nadeem's forward looking analysis specialises on UK inflation, economy, interest rates and the housing market and he is the author of the NEW Inflation Mega-Trend ebook that can be downloaded for Free. Nadeem is the Editor of The Market Oracle, a FREE Daily Financial Markets Analysis & Forecasting online publication. We present in-depth analysis from over 600 experienced analysts on a range of views of the probable direction of the financial markets. Thus enabling our readers to arrive at an informed opinion on future market direction. http://www.marketoracle.co.uk
Disclaimer: The above is a matter of opinion provided for general information purposes only and is not intended as investment advice. Information and analysis above are derived from sources and utilising methods believed to be reliable, but we cannot accept responsibility for any trading losses you may incur as a result of this analysis. Individuals should consult with their personal financial advisors before engaging in any trading activities.
|
Nadeem Walayat Archive
|