* This is the US Dollar continuous chart (/DX) on a one hour view of the past 10 days with my standard True Strength Index (TSI) indicator (7,4) setting. * The trend line breaks of the TSI indicator did a very nice job of nailing 5 profitable opportunities to short the US Dollar within this timeframe. It now appears that the TSI is about to signal a new opportunity to short the US Dollar. I expect with this signal gold and silver will discontinue their fall of the last few hours and rally overnight. * Click on the chart to ENLARGE * I guess we'll see how it turns out in the morning. Good night.
 |
| Click on the chart to ENLARGE |
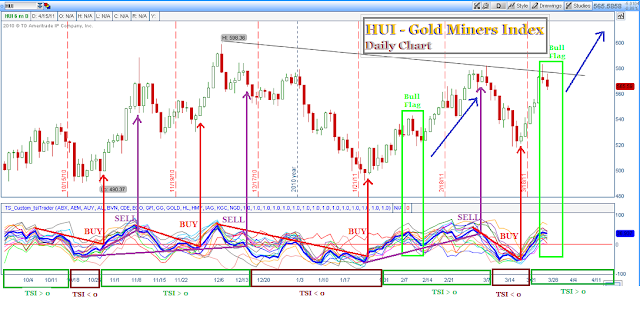
* This is a daily chart of the Gold Bugs Index (HUI) covering the past 6 months. The custom software I am using plots the True Strength Index (TSI) indicator reading below the price action of not only the HUI index, but also the individual mining stocks that are members of the index. * I've put a lot of information on this chart but will slow it down and explain what is there. * The buy and sell signals I have identified using my favorite TSI technique - the trend line break. One simply connects the low points of the TSI indicator as it rises and when the indicator does not maintain that particular trend line, it "breaks" and yields a sell signal. Likewise, a buy signal is generated by connecting the high points of the TSI as it falls. When the indicator does not maintain that particular trend line, a buy signal is generated. * Along the lower portion of the chart I have identified when the TSI was mostly above ZERO, and when it was mostly below ZERO. This is another excellent buy/sell technique to use. When the TSI is above ZERO and rising, price is always rising. And, when the TSI is below ZERO and falling, price is always falling. * The trend line breaks I identified did a very nice job of accurately and quickly locating the buy and sell swings. Currently this technique is suggesting we are still on a buy signal. * The ZERO line crossover also did a very nice job of accurately and almost as quickly locating the main buy and sell swings, but it did not catch some of the smaller swings. The reason for this is simple. As long as the TSI remains above ZERO, price is generally rising. Small price dips within this context are usually not significant enough to cause the indicator to fall below ZERO and trigger a sell signal. And the reverse is true when the TSI is below ZERO. * The last thing I would like you to notice are the two bull flags that I have identified. In the first case price movement was enough to drive the TSI down to the ZERO line. This is actually very very common (for some reason that I have not yet figured out). Once the TSI reached the ZERO line it bounced right back up and another rally followed. * A second instance of a bull flag is suggested by our price action of the preceding two days. It would not surprise me if this flag is developed a little further early in the week, the TSI reaches ZERO, bounces, and then a new rally takes us to new highs. * So there you have it.....and I think things look real good going forward. If you'd like some help making more sense of the True Strength Index (TSI) indicator, send me your question or a chart with your thoughts and I'll do my best to get it working for you. John tsiTrader@gmail.com
Posted by John Townsend, The TSI Trader at 1:08 PM 5 comments