US Dollar Index – Nearing an Intermediate High
Technical observations of RossClark@shaw.ca
Bob Hoye
Institutional Advisors
Posted Oct 6, 2011
Written Oct 3, 2011
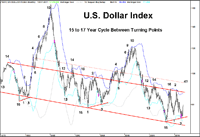
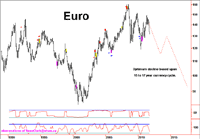
The U.S. Dollar continues to move in unison with the turns in the fifteen to seventeen-year cycle. The September 2nd close above its 100-day moving average after the 18 week consolidation was the catalyst we identified for the current advance (following Point 3’s on the chart). Prices are now at another definable juncture.
It has been 108 trading days since the Dollar bottomed on May 2nd and prices have advanced 9%. The 1995 low in the cycle saw a similar 8.4% rise over a period of 105 days. The cycle low in 1980 saw prices advance by 10% in 108 days. Each occurrence also exhibited a bearish divergence in the RSI(14) at this point of development. Based upon these examples we should look for an interim top soon that is followed by a 50% to 62% correction of the rally from the July-August lows (currently 76.55 to 75.82) that tests the 89-day exponential moving average and the 34-day Bollinger Band. This could take four to five week. If the Dollar holds at support it should be capable of pushing into the 90’s.

Daily charts: 1980, 1995 and current


###
-Bob Hoye
Institutional Advisors
email: bobhoye@institutionaladvisors.com
website: www.institutionaladvisors.com
Hoye Archives