How Long The Natural Gas Supply Risk Will Remain
posted on
Oct 06, 2011 01:29PM

Edit this title from the Fast Facts Section

To be completely transparent, this past spring, my estimate for natural gas prices for the end of 2011 were clearly too high. However, taking into account a smorgasbord of bearish signals (including oversupply and the current recession risk), and the instability of functional price drivers, I cannot but revise it downward. But is it really a long run bearish story?
The decoupling of WTI and Nymex natural gas prices is mostly due to the surge in shale gas production. Neither physics (the thermal parity is 6-to-1) nor technology (the increasing role of combined cycle gas turbines in electricity generation, natural gas accounting for 24% of power generation in 2010 vs. 16.7% in 2003) can explain the deviation of the WTI/NG ratio away from its historical range.
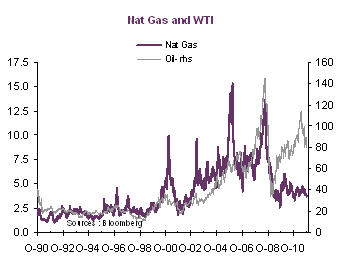
Even if you explain why the spread is no longer relevant (though the correlation of weekly changes of both WTI and natural gas remains significantly positive), the main drivers of natural gas still need to be sorted.
Below is a model that depends on well identified factors:
WTI: in spite of the Cushing glut and the loosening relationship between both series, oil prices continue to drive natural gas prices (heating oil is a by-product of the WTI distillation process and competes with natural gas for heating purposes).
Inventories: we found that the difference between today’s inventories and the average of the last 3-years monthly inventories has solid explanatory power.
USD: the natural gas market is a local market: it should not react to the external value of the USD. But as the latter drives prices of the whole commodity spectrum we find some statistically significant explanatory power (but it is likely indirect).
Hurricanes: can generate supply and non-cyclically explained price jumps that are corrected by dummies.
The link between natural gas prices and industrial or manufacturing production is very loose. Still, we find only a slightly positive link with electricity production.
The model below shows that in spite of these factors, we fail to explain the break that occurred in 2008. It just shows that we cannot model natural gas prices properly without taking into account the sharp break in shale gas supply.
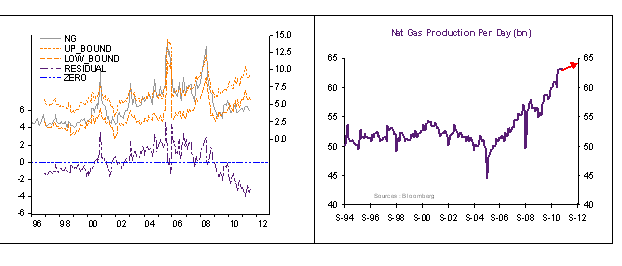
Introducing the supply factor into our model, one get a much better fit (visually).
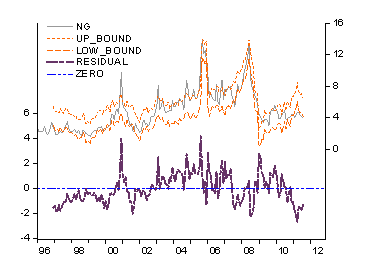
Natural gas prices are still $2 below fair value. The current consensus for 2012 is an average price of $4.37/MMbTu with a close to historically low percentage of bullish views (23.08%). Should this be considered a contrarian indicator and a signal for higher prices to come?
Fundamental Drivers
On the demand side, though it has increased somewhat in recent quarters, industrial production in the U.S. has not been able to keep demand high for natural gas. In fact, only electricity generation (which already amounts to nearly 35% of natural gas consumption) is increasing their natural gas use, while other sectors have remained flat.
The import/export mix has reversed recently, but LNG export capacity is too small for any significant export-led demand to spur natural gas prices right now (must have U.S. LNG export facilities in place).
On the supply side, storage oversupply is a major factor in keeping prices low. Storage refills in September neared an all-month high.
Shale has a strong role to play. Despite some contentions that natural gas drilling may be reaching to relative limits of efficiency/profitability (drilling costs may be outpacing prices), production of natural gas has continued at record pace. Interestingly (and in spite of the flows, given the fact that some rigs extract both), the ratio of oil to natural gas rigs count has fallen sharply in recent years. The diagram below may explain what is at play.
Concession leases may explain why the oversupply remains. But if you consider that reserves have been slightly overstated (the most recent U.S. Geologist Survey has directly contradicted EIA reports of natural gas reserves in the U.S., as they have cut resource estimates to 84 trillion cubic ft - 20% of what the EIA had estimated) and that there is still the looming issue on regulation, prices may go up. This is not straight forward, as the coal to natural gas price ratio has risen in spite of the regulation-linked disincentive to use coal in power generation.
Within the current policy mix, there is tension between policy regulation/deregulation of natural gas which sends mixed signals. The Republicans have called for across-the-board energy deregulation to increase the competitiveness of the U.S. economy and help create jobs. Meanwhile, the Joint Select Committee on the Marcellus Shale in West Virginia recently passed new natural gas drilling regulations that include public comment and hearings on gas well permits, increased notification when a company drills, and most importantly, the transfer the duties of the Oil and Gas Board to the Department of Environmental Protection, which will put downward pressure on prices.
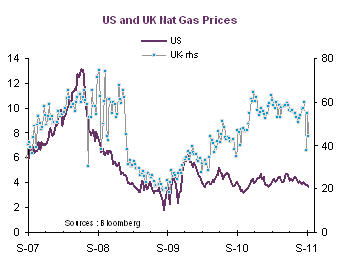
Exporting takes predetermined piping and storage facilities, this will take some time (probably 2015) until it can be efficiently utilized. Yet, U.S. is still quite cheap compared to U.K. natural gas (and has remained resiliently cheap even as U.K. prices rose in September 2009). This may incentivize exports in the future.
Conclusion:
Short term factors are pressuring natural gas downward, whereas long run factors are clearly bullish. The difficulty is deciphering when short-term will transition into long-term. I am tempted to say sooner than expected. Short run downward risk does exist as the economy is close to recession and risky markets may have further to fall. A 960 level for the SP 500 would be consistent with natural gas prices close to 3 USD/mmbtu.
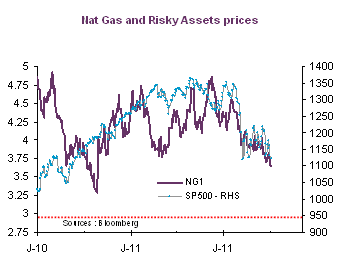
But we lean toward higher prices in the middle of next year than the common expectation ($4.25). If there will be a recession, chances are it has already begun.
Disclosure: I have no positions in any stocks mentioned, and no plans to initiate any positions within the next 72 hours.