Some interesting TSX charts
posted on
Apr 16, 2013 07:28PM

Edit this title from the Fast Facts Section


Energy and metals are tumbling today, continuing a cyclical downtrend that has been in play since the consumer credit-fueled demand bubble burst in 2008. Gold and silver are leading the fall, down nearly 5 and 4% on the day, oil (WTI) is down nearly 3%. It is particularly significant that this weakness is accelerating without the help of a rising U$ today, as the Greenback is so far unchanged. A catalyst here may be Bank of Japan-induced sudden weakness in Japanese bonds this week, forcing levered players to sell other markets/assets to raise cash…yet another reminder of why highly levered global participants present a capital risk for all markets. North American bonds however are not being sold. Yields are sharply lower across the curve: the US 10 year at 1.72 and 30 year at 2.92. The flight to relative safety remains alive and well.
Whatever the precise cause or catalysts, lower commodity prices and interest rates are signaling deflation especially when coupled with weak employment and despite the kamikaze inflationary efforts of central bankers.
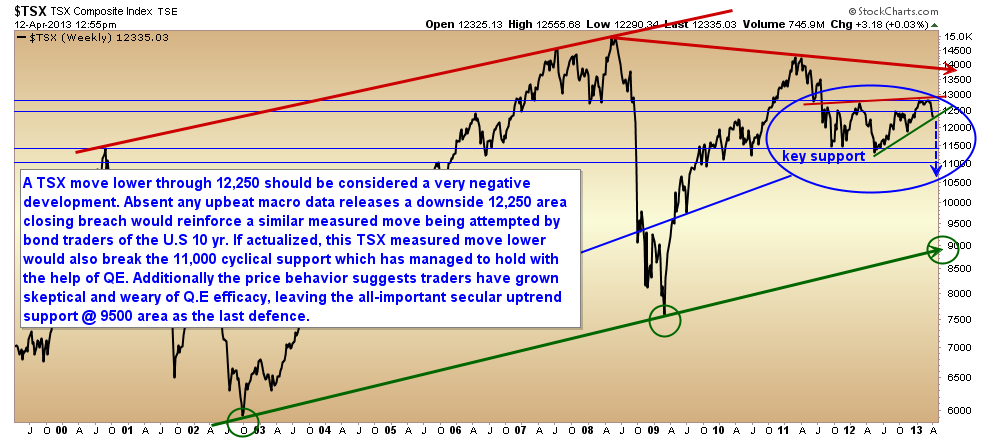
Mining companies are being particularly hard hit by the concoction of weak demand, soaring inventories and margin calls. Gold miners (XGD below) are down a further 5% today. This updated chart of the Canadian market internals tells the story, with the TSX down on the week but so far still propped up by the mirage of support from its over-valued financial sector. We are reminded of a reminiscent pattern of weakening internals at the outset of both the 2001 and 2008 bear markets–just before the TSX went on to lose 50% each time.
Chart source: Cory Venable, CMT, Venable Park Investment Counsel Inc.
The broad markets are wobbling over the heads of income investors huddled under the hope that dividend paying stocks will offer shelter from capital losses. Sadly, it has never worked that way.
Chart source: Cory Venable, CMT, Venable Park Investment Counsel Inc.