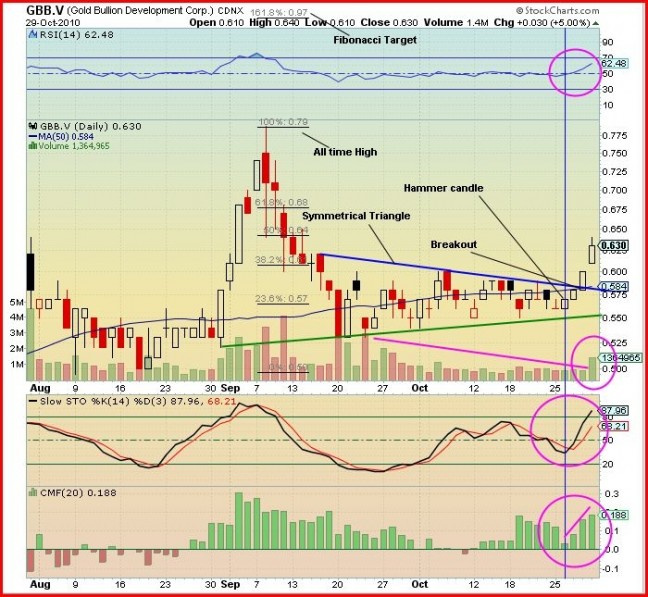
John: Today, Gold Bullion Development (GBB, TSX-V) opened at 61 cents, its low, rose to a high of 64 cents and then closed at 63 cents for a gain of 3 pennies on total CDNX volume of 1.4 million shares – the highest volume day in a month. Very shortly after the open this morning the company announced the closing of its $8 million private placement.

Looking at the 3-month daily chart above, we see that GBB gapped up slightly at the open today, from the previous close of 60 cents to 61 cents, indicating buying strength. The chart shows a symmetrical triangle (blue line on top and green line at the bottom) as the trading pattern which started on September 16.
On Thursday there was a breakout above the top of the triangle at a point approximately 3/4 of the distance between the start of the triangle and the apex (the apex is the point where the blue and green lines meet – not shown.) This is important because TA research has shown that at this area breakouts have the greatest upward force.
Between September 16 and October 25 the stock had been consolidating, waiting for news with gradually diminishing daily volumes (downsloping mauve lines). Then on September 26 there was a bullish reversal “hammer” candle which started the reversal to the upside. The thin blue vertical line pinpoints the reversal.
The set of Fibonacci levels (horizontal black lines) shows the next target level is 97 cents. With 79 cents being the all-time high, we can expect strong resistance at this point especially since the previous move up was completely retraced. We can also expect resistance at 64 cents (50% level) which we saw today and at 68 cents (61.8% level).
Looking at the indicators:
The RSI has crossed above the 50% level and is at 62% and pointing up – very bullish.
The Slow Stochastics has both the %K and the %D at 87% and 68%, respectively. Both are pointing up with plenty of room to move higher even with the %K in the overbought region – very bullish.
The Chaikin Money Flow (CMF) indicator had low buying pressure on the reversal day but has increased every day since. This will continue to increase – very bullish.
Outlook: The chart pattern and the indicators all point to a serious move upward in the near future.

