Taken from poster canestal1 [ABB] on another forum Gold making a major move to the upside.
------------------------------------...
Chart 1: Gold Weekly Continuous Contracts. MACD shows crossover and spot price closing above the MA(50). Also shows gold breaking the $SPX 1:1 ratio barrier.
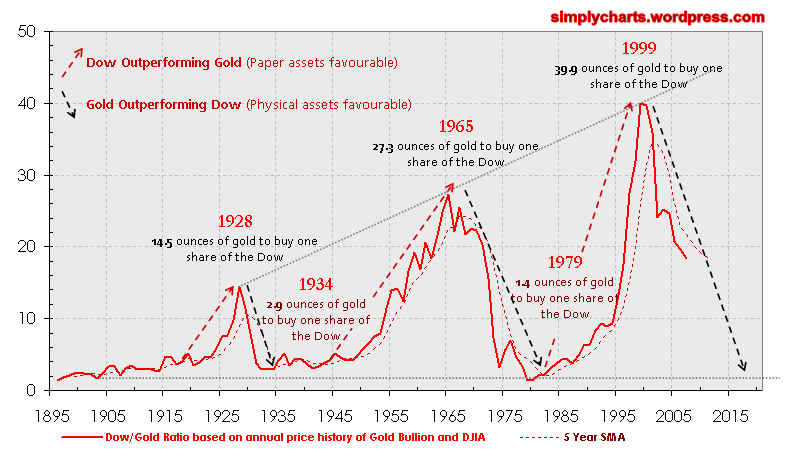
http://stockcharts.com/h-sc/ui?s=$GO... Chart 2: Gold vs. Dow ratio. Ratio chart shows the possibility of up to 10 years of sustained gold growth in comparison to DOW JONES INDU.
http://simplycharts.files.wordpress.... Chart 3: Decline of the USD. The performance of the USD is inversely proportional to gold. The USD is in a sustained state of decline. A weaker USD buys less gold, and gold is a store of value. As the USD declines, gold prices climb. Last USD rally was a result of a 'rush' to liquidity. See MACD for negative crossover.
http://stockcharts.com/h-sc/ui?s=$US... Chart 4: US Debt as a percentage of GDP. High debt levels reduce foreign investment and send money to gold.
http://www.gooznews.com/archives/deb...


