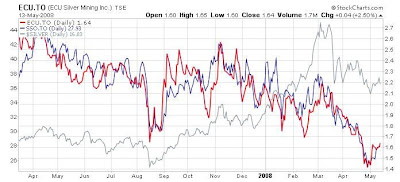
A few weeks back ESL posted a very revealing chart that compared the relative performance of ECU Silver versus Silver Standard (SSO) which happens to be the largest publicly traded in ground holder of silver resources at greater than 1.5 billion oz of Ag equivalent (P&P, M&I, & Inf.).
They have properties in three continents and are in production, yet if you examine the chart below you will notice an unmistakable similarity to the chart for ECU in red. I have included the silver chart for reference in gray where you can clearly see a divergence beginning at the end of 2007.
Now I can't recall the number of times that I have heard from some of the posters at SH that the anemic performance is exclusive to ECU and is partly due to their decision to cease production to focus on exploration. If this is the case then it begs the question, why has SSO been afflicted with the same price performance over the last year?
