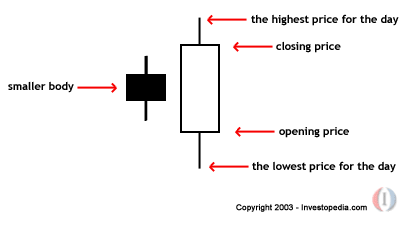
Was the recent double bottom formation denied? According to the definition, a close below the low of both lows by greater then 5% would say yes. But was it? Remember the numbers are not an exact measurement and we were very oversold and did expect a bounce. And stocks do not always participate as technical events suggest they should. Well today we got a bounce and a suggestion of yet further evidence that NOT wants to put a bottom in to reverse its recent downtrend. Today the pattern is suggesting a bullish engulfing formation which needs to be confirmed; a confirmation would be SP action similar to what we saw today with a preference to a gap opening. (closing at the high is very bullish-White Closing Marubozu that scares the bears with buyers buying the bids coupled with short covering to get out) Look at the example of pattern below remembering we closed at the high and compare against the last tow trading days of NOT and ask is this a bullish engulfing pattern? If so, see it if it confirmed by tomorrows price action. Also, IF the Double bottom is still in play then we need to move above $5.25 which is the recent high (resistance).
| Bullish Engulfing Pattern |
 |
A chart pattern that forms when a small black candlestick is followed by a large white candlestick that completely eclipses or "engulfs" the previous day's candlestick. The shadows or tails of the small candlestick are short, which enables the body of the large candlestick to cover the entire candlestick from the previous day.

|
| |
 |
As implied in its name, this trend suggests that the bulls have taken control of a security’s price movement from the bears. This type of pattern usually accompanies a declining trend in a security, suggesting that a low or end to a security's decline has occurred. However, as usual in candlestick analysis, the trader must take the preceding and following days' prices into account before making any decisions regarding the security. |
|
A reversal pattern that can be bearish or bullish, depending upon whether it appears at the end of an uptrend (bearish engulfing pattern) or a downtrend (bullish engulfing pattern). The first day is characterized by a small body, followed by a day whose body completely engulfs the previous day's body.

