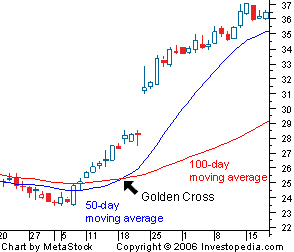
Re: Silverado Daily Chart "The Golden Crossing * Change is in the Wind"
in response to
by
posted on
Sep 14, 2010 02:22PM


Silverado is quickly approaching a major event on the daily price chart called "The Golden Crossing." The 20 day moving average line is close to the 200 day moving average, a breakout above the 200 would signal a positive trend is developing for the stock. Silverado's 20 day is currently at .0050 and the 200 day moving average is at .0052
If the stock can keep this momentum going forward on the daily chart, we will eventually see the 50 day moving average push above the 200 day moving average line, undoing all the damage that the short traders have done on the daily chart.
Keep in mind that the weekly charts are built upon the foundation of daily charts so hopefully we will see "The Golden Crossing" playout all over again on the weekly chart. At that historical point in time, the chart will be turned completely right sideup at the hands of the longs taking control of painting the chart !!
$$ Ka-Ching Ka-Ching $$
