Re: Dow/Gold ratio
in response to
by
posted on
Nov 27, 2008 06:47AM

San Gold Corporation - one of Canada's most exciting new exploration companies and gold producers.

How to choose the best bolt-hole for your savings and wealth? Clearly real estate's doomed, for the short to mid-term at least. Government bond yields are now so far underwater, you'd be killed by the bends if they tried to come up for air.
That leaves commodities and stocks, the classic refuges for inflationary crises. And one way of judging the Dow – free from all Dollar distortions – is to measure the index in terms of gold ounces.
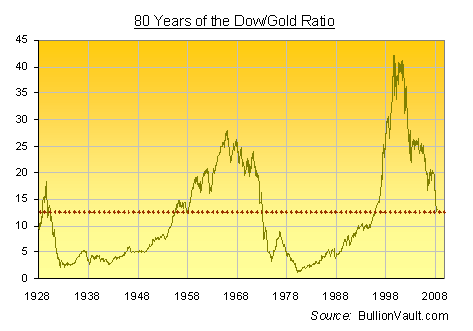
Dividing the Dow Jones Industrial Average by the price of gold gives you a rough idea – over time – of where the real value might lie. It shows how many ounces of gold you would need to buy one unit of Dow stocks.
Hence gold was a raging sell (in hindsight at least) when the Dow/Gold ratio touched 1.0 at the start of the 1980s. Stocks scarcely looked back for the next 20 years. But by the end of the '90s, the real value had shifted again. And gold surged as the Dow sank after the Tech Stock Crash of 2000.
That slump in stock prices compared with Gold [4] pushed the Dow/Gold ratio down from its all-time top above 42.2 to just 12.6 in March of this year.
That's pretty much exactly the Dow/Gold average of the last eighty years. So which way will the ratio go now?
The Fed's new "reflationary melt-up" is clearly designed to keep stock prices buoyant. But it's only adding to the Case for Gold [4], too. "I would be very surprised if the Dow Jones Industrials/Gold Ratio didn't decline to between 5 and 10 within the next three years," said Marc Faber of the Gloom, Boom & Doom Report recently.
If that call proves right, it might come thanks to Gold Prices [5] doubling, or stock prices halving, or more likely some combination of both. But while the three peaks to date – of Aug. 1929, Jan. '66 and then late '99 – took the Dow/Gold's top higher, the floor only held steady, down there at two ounces of gold and below.
And the last slump – during the inflationary 1960s and stagflationary '70s – took a full 14 years to work itself out. So far in this bear market for the Dow/Gold ratio, we're nine years through to date.
E, while you're calling for a "spike" to the downside for the Dow, in that same time-frame, a "spike" to the upside for gold is as realistic! That's where the "mathematics" of your equation becomes is distorted beyond the "mean" for gold, and, where, as "investors" in physical or equities we should "fly de coupe!"
"Economics is not science and the Dow/Gold ratio has no "scientific" basis or bounds!"
At some point you may well be right!
RUF
RUF